303 questions asked across 4 exam years, newest first
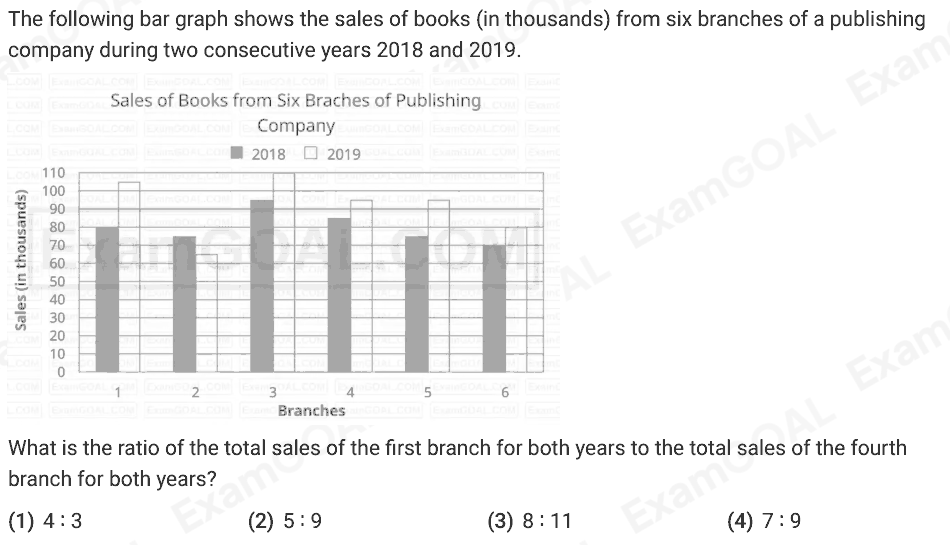
The following bar graph shows the sales of books (in thousands) from six branches of a publishing company during two consecutive years 2018 and 2019. What is the ratio of the total sales of the first branch for both years to the total sales of the fourth branch for both years?
Answer: D
उन संख्याओं के HCF और LCM के बीच का अनुपात क्या है जिनका LCM 48 है और संख्याओं का गुणनफल 384 है?
Answer: B
1.6 और 3.6 के मध्यानुपाती और 5 और 8 के तृतीयानुपाती का अनुपात कितना है?
Answer: C
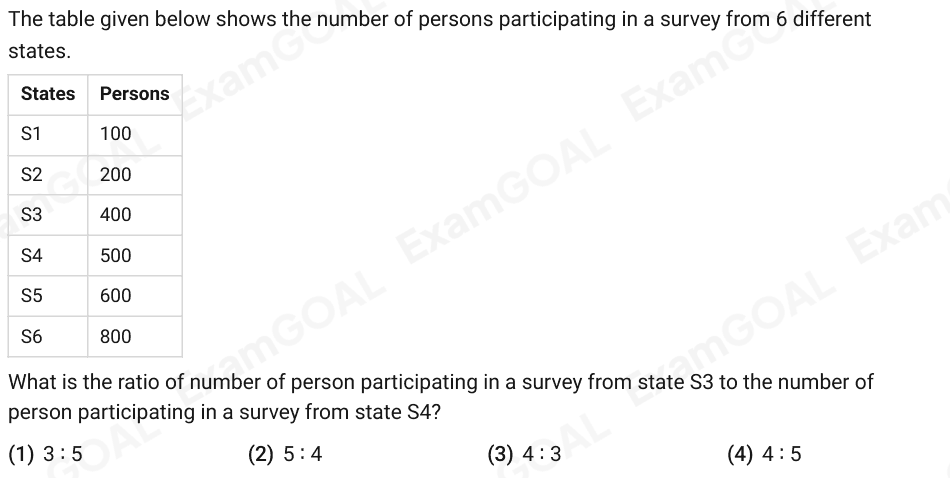
The table given below shows the number of persons participating in a survey from 6 different states. States Persons S1 100 S2 200 S3 400 S4 500 S5 600 S6 800 What is the ratio of number of person participating in a survey from state S3 to the number of person participating in a survey from state S4?
Answer: D
दो संख्याएँ 6 ∶ 5 के अनुपात में हैं। यदि उनका HCF 3 है, तो दोनों संख्याओं का LCM क्या है?
Answer: C