59 questions asked across 4 exam years, newest first
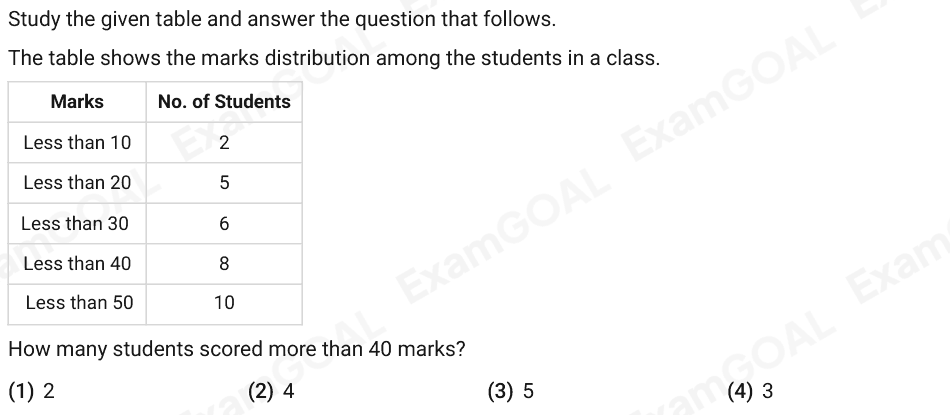
Study the given table and answer the question that follows. The table shows the marks distribution among the students in a class. Marks No. of Students Less than 10 2 Less than 20 5 Less than 30 6 Less than 40 8 Less than 50 10 How many students scored more than 40 marks?
Answer: A
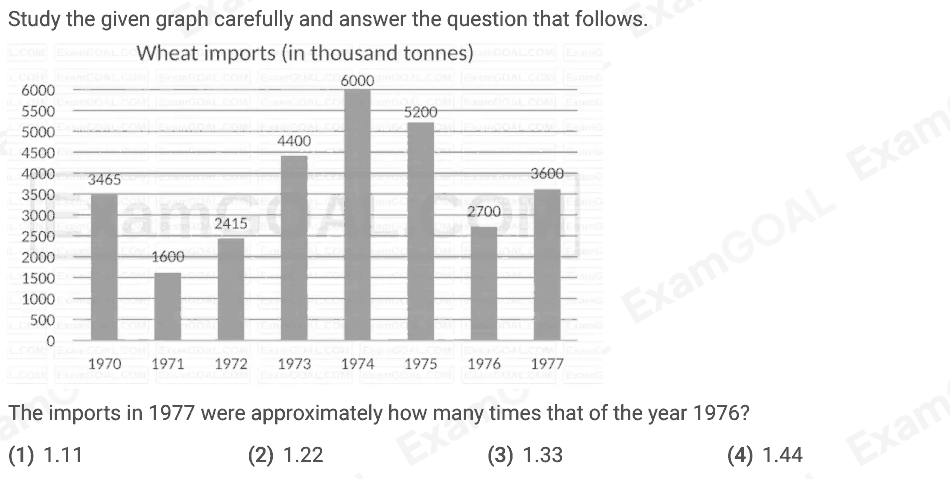
Study the given graph carefully and answer the question that follows. The imports in 1977 were approximately how many times that of the year 1976?
Answer: C
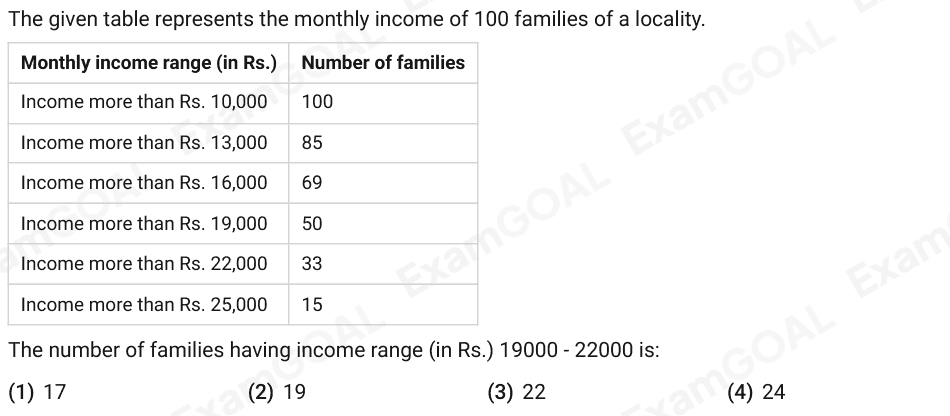
The given table represents the monthly income of 100 families of a locality. Monthly income range (in Rs.) Number of families Income more than Rs. 10,000 100 Income more than Rs. 13,000 85 Income more than Rs. 16,000 69 Income more than Rs. 19,000 50 Income more than Rs. 22,000 33 Income more than Rs. 25,000 15 The number of families having income range (in Rs.) 19000 - 22000 is:
Answer: A
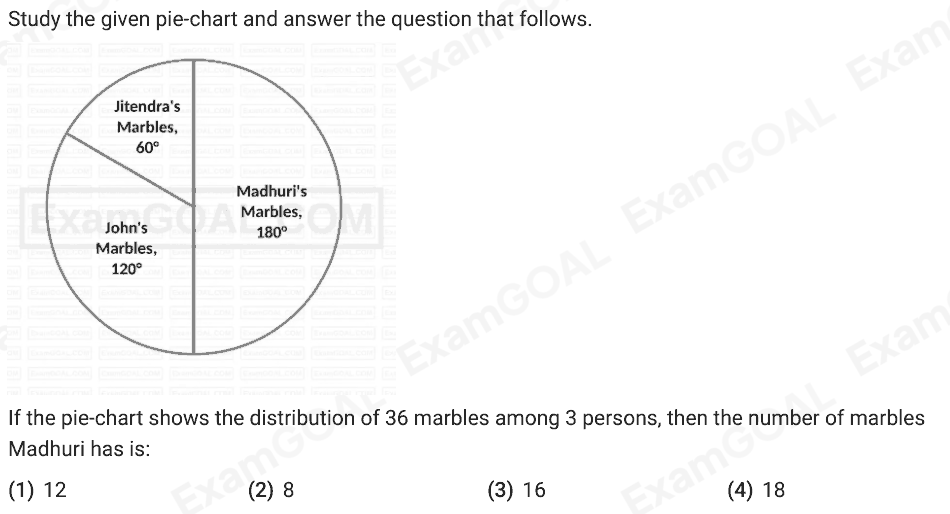
Study the given pie-chart and answer the question that follows. If the pie-chart shows the distribution of 36 marbles among 3 persons, then the number of marbles Madhuri has is:
Answer: D
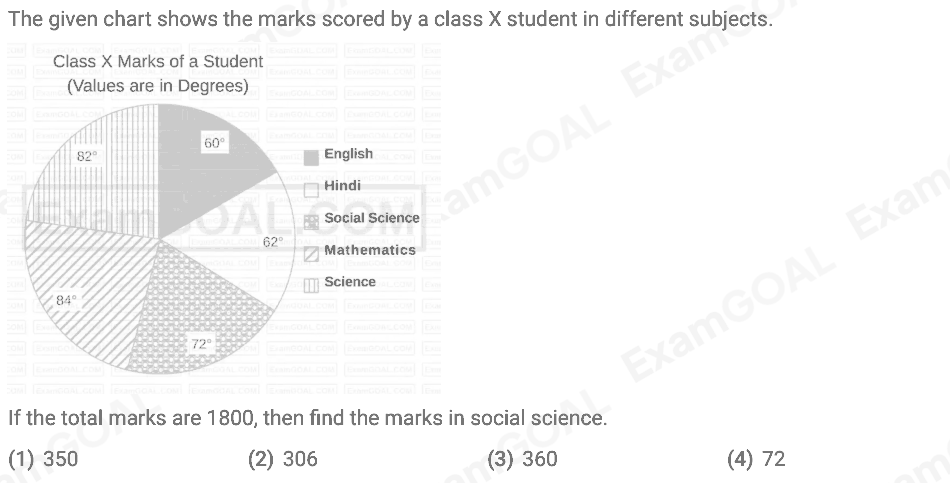
The given chart shows the marks scored by a class X student in different subjects. If the total marks are 1800, then find the marks in social science.
Answer: C
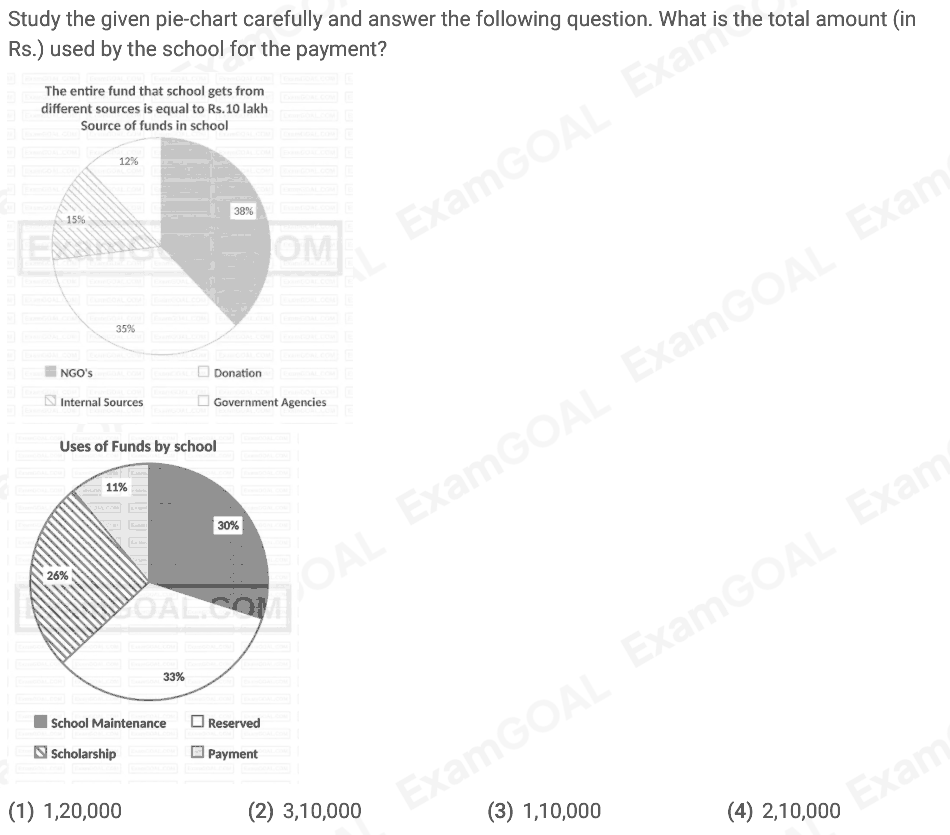
Study the given pie-chart carefully and answer the following question. What is the total amount (in Rs.) used by the school for the payment?
Answer: C
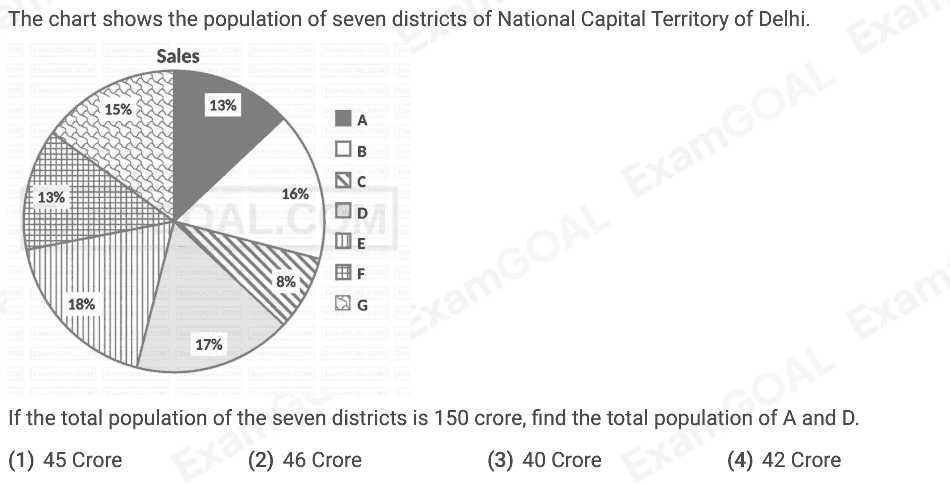
The chart shows the population of seven districts of National Capital Territory of Delhi. If the total population of the seven districts is 150 crore, find the total population of A and D.
Answer: A
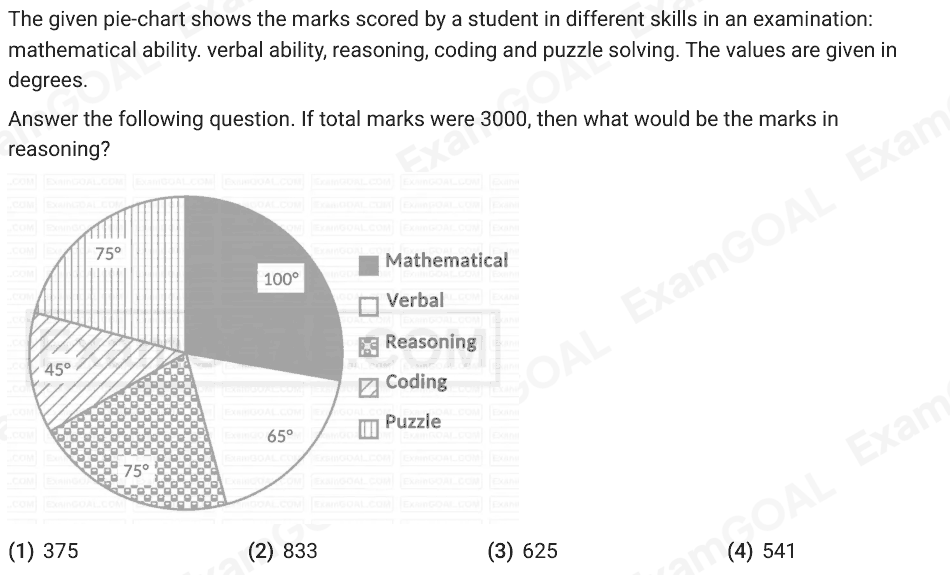
The given pie-chart shows the marks scored by a student in different skills in an examination: mathematical ability. verbal ability, reasoning, coding and puzzle solving. The values are given in degrees. Answer the following question. If total marks were 3000, then what would be the marks in reasoning?
Answer: C
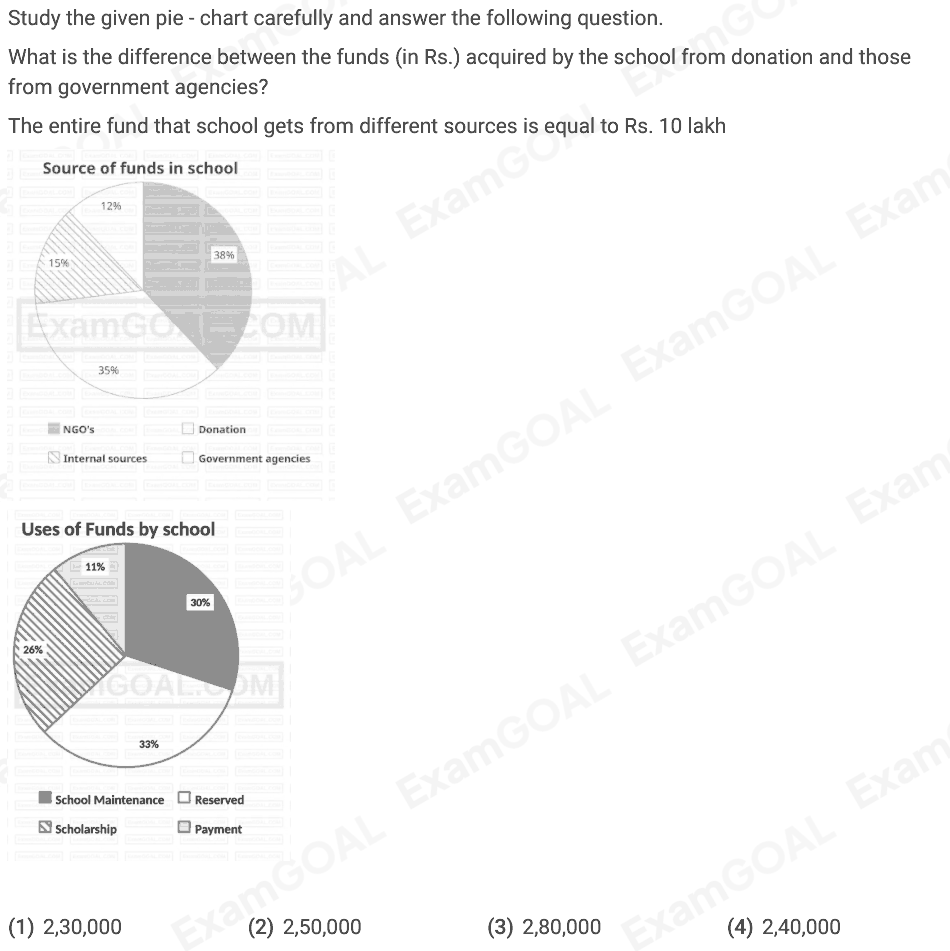
Study the given pie - chart carefully and answer the following question. What is the difference between the funds (in Rs.) acquired by the school from donation and those from government agencies? The entire fund that school gets from different sources is equal to Rs. 10 lakh
Answer: A
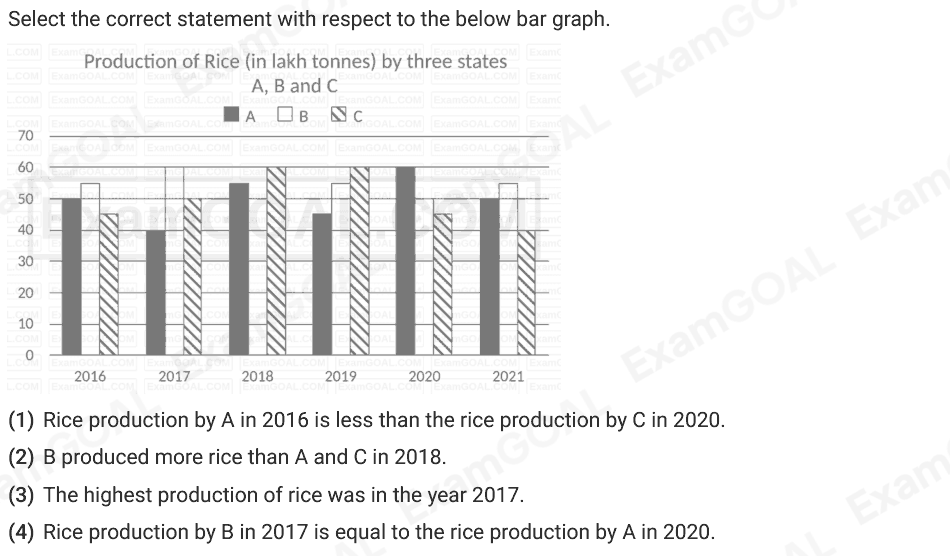
Select the correct statement with respect to the below bar graph.
Answer: D
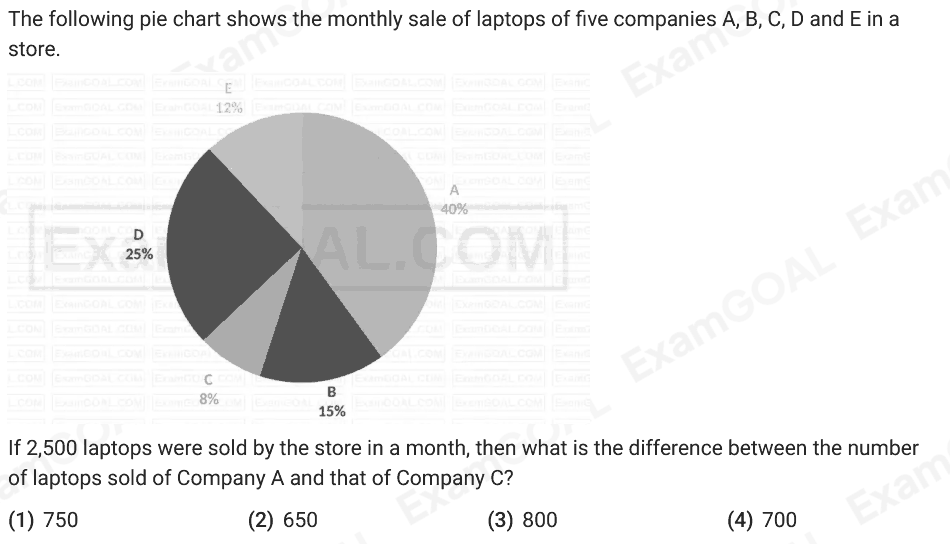
The following pie chart shows the monthly sale of laptops of five companies A, B, C, D and E in a store. If 2,500 laptops were sold by the store in a month, then what is the difference between the number of laptops sold of Company A and that of Company C?
Answer: C
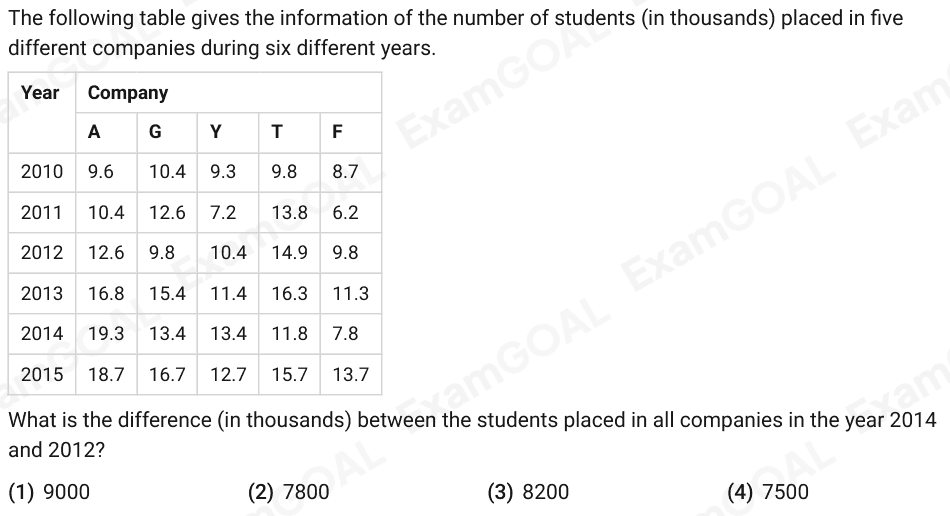
The following table gives the information of the number of students (in thousands) placed in five different companies during six different years. Year Company A G Y T F 2010 9.6 10.4 9.3 9.8 8.7 2011 10.4 12.6 7.2 13.8 6.2 2012 12.6 9.8 10.4 14.9 9.8 2013 16.8 15.4 11.4 16.3 11.3 2014 19.3 13.4 13.4 11.8 7.8 2015 18.7 16.7 12.7 15.7 13.7 What is the difference (in thousands) between the students placed in all companies in the year 2014 and 2012?
Answer: C
A constable Ram is 225 m behind a thief Somesh. Ram runs 50 m and Somesh runs 30 m in a minute. At what time will the constable Ram catch the thief Somesh?
Answer: D