59 questions asked across 4 exam years, newest first
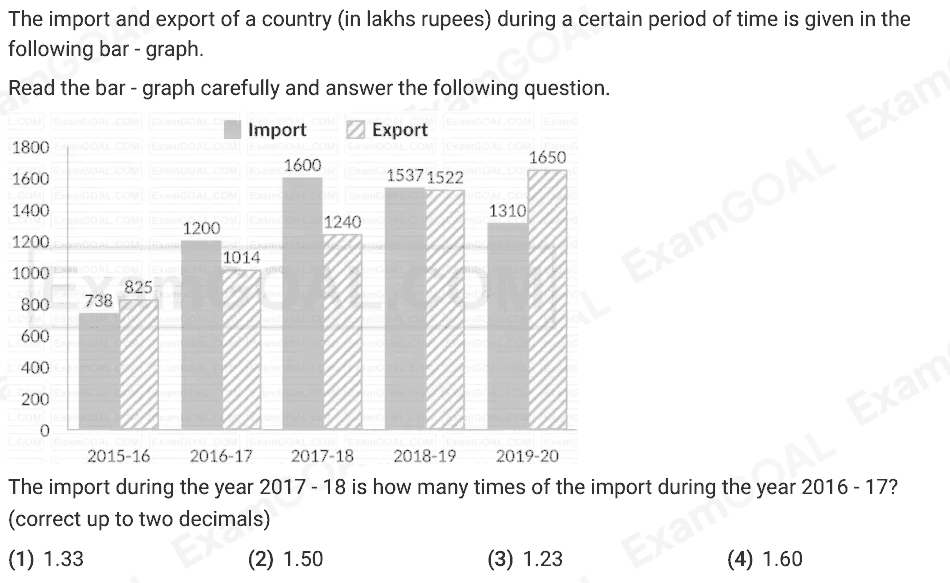
The import and export of a country (in lakhs rupees) during a certain period of time is given in the following bar - graph. Read the bar - graph carefully and answer the following question. The import during the year 2017 - 18 is how many times of the import during the year 2016 - 17? (correct up to two decimals)
Answer: A
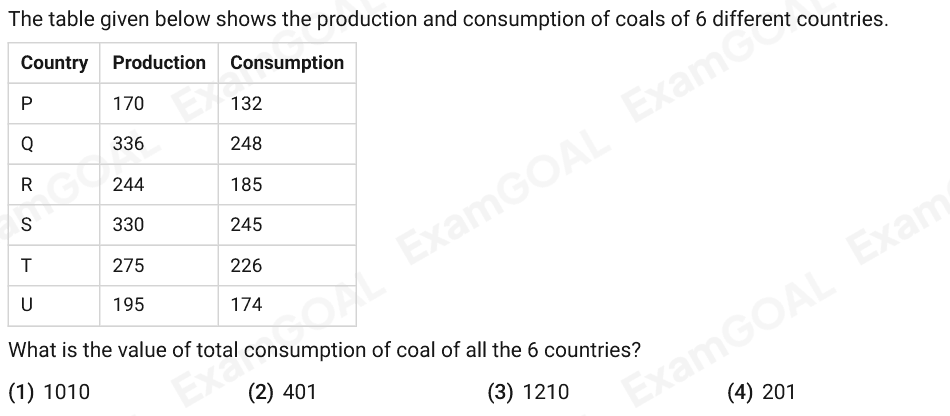
The table given below shows the production and consumption of coals of 6 different countries. Country Production Consumption P 170 132 Q 336 248 R 244 185 S 330 245 T 275 226 U 195 174 What is the value of total consumption of coal of all the 6 countries?
Answer: C
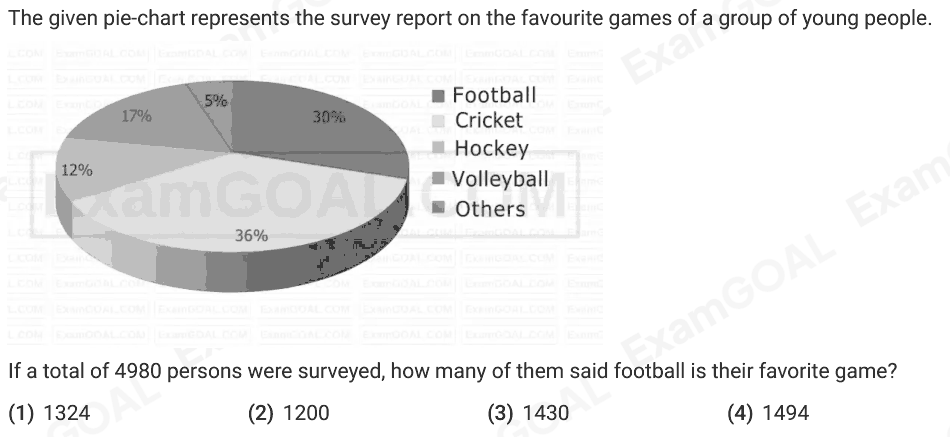
The given pie-chart represents the survey report on the favourite games of a group of young people. If a total of 4980 persons were surveyed, how many of them said football is their favorite game?
Answer: D
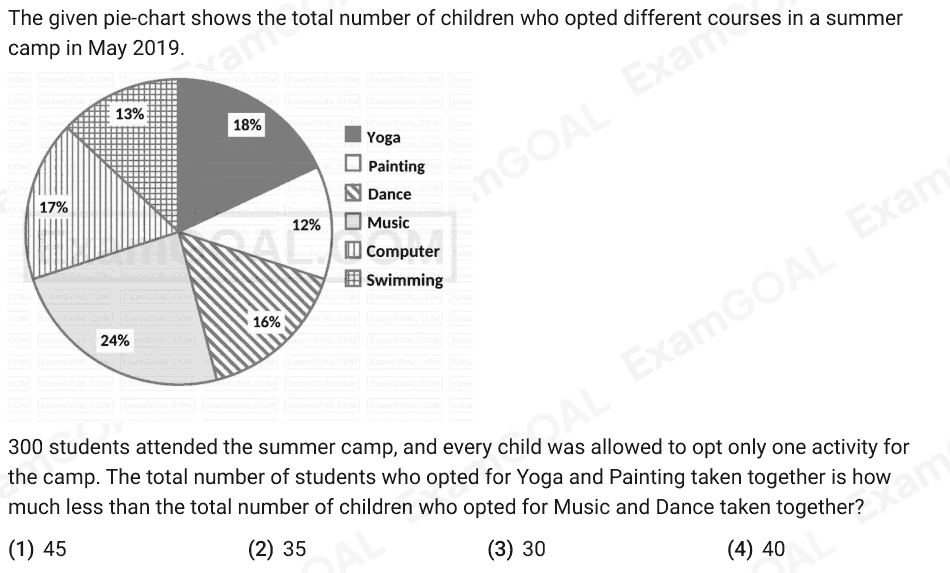
The given pie-chart shows the total number of children who opted different courses in a summer camp in May 2019. 300 students attended the summer camp, and every child was allowed to opt only one activity for the camp. The total number of students who opted for Yoga and Painting taken together is how much less than the total number of children who opted for Music and Dance taken together?
Answer: C
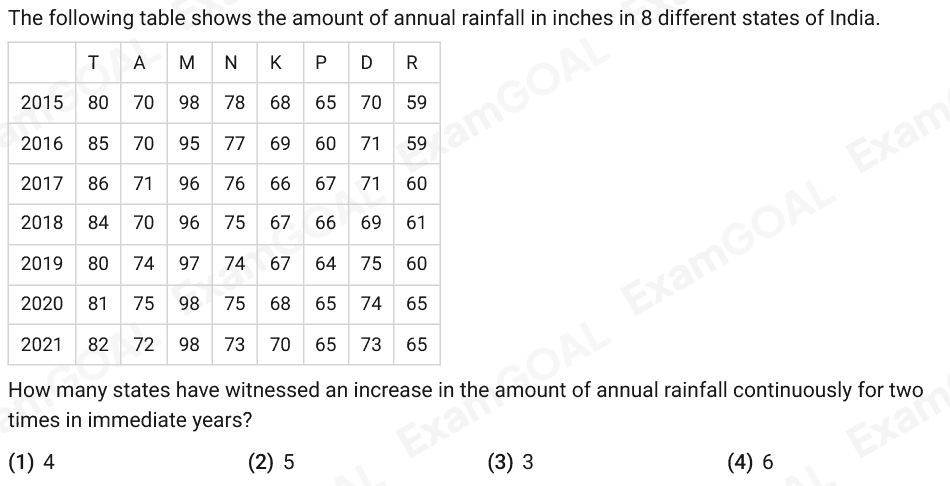
The following table shows the amount of annual rainfall in inches in 8 different states of India. T A M N K P D R 2015 80 70 98 78 68 65 70 59 2016 85 70 95 77 69 60 71 59 2017 86 71 96 76 66 67 71 60 2018 84 70 96 75 67 66 69 61 2019 80 74 97 74 67 64 75 60 2020 81 75 98 75 68 65 74 65 2021 82 72 98 73 70 65 73 65 How many states have witnessed an increase in the amount of annual rainfall continuously for two times in immediate years?
Answer: B
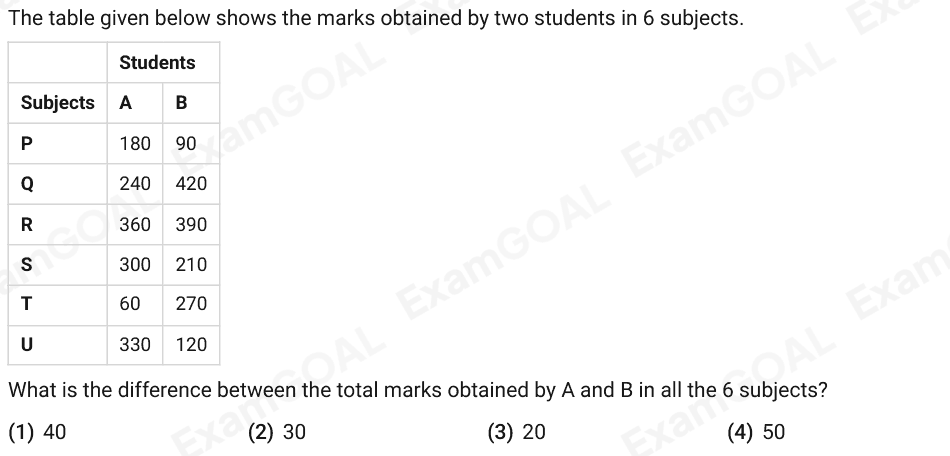
The table given below shows the marks obtained by two students in 6 subjects. Students Subjects A B P 180 90 Q 240 420 R 360 390 S 300 210 T 60 270 U 330 120 What is the difference between the total marks obtained by A and B in all the 6 subjects?
Answer: B
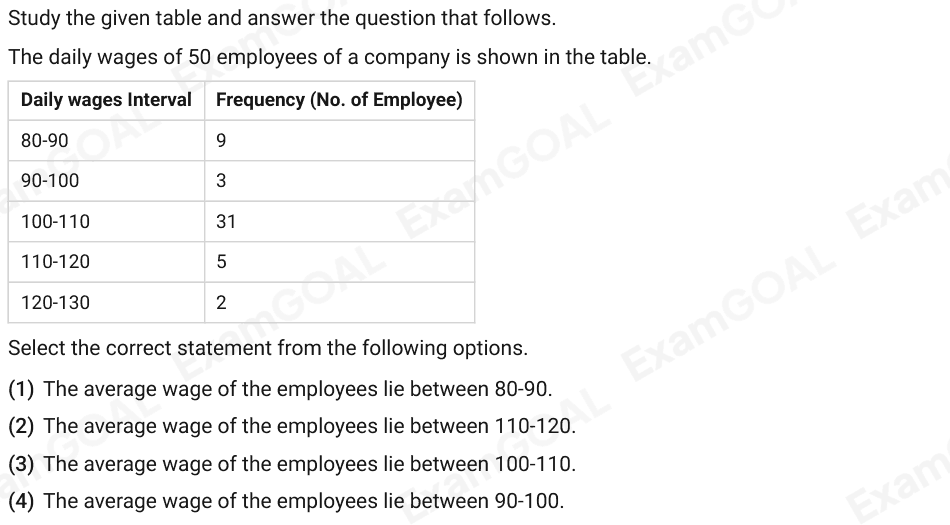
Study the given table and answer the question that follows. The daily wages of 50 employees of a company is shown in the table. Daily wages Interval Frequency (No. of Employee) 80-90 9 90-100 3 100-110 31 110-120 5 120-130 2 Select the correct statement from the following options.
Answer: C
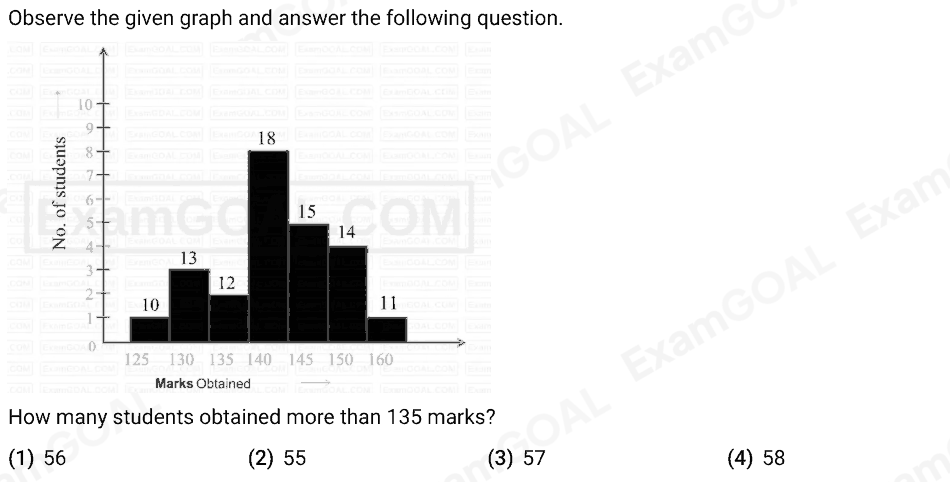
Observe the given graph and answer the following question. How many students obtained more than 135 marks?
Answer: D
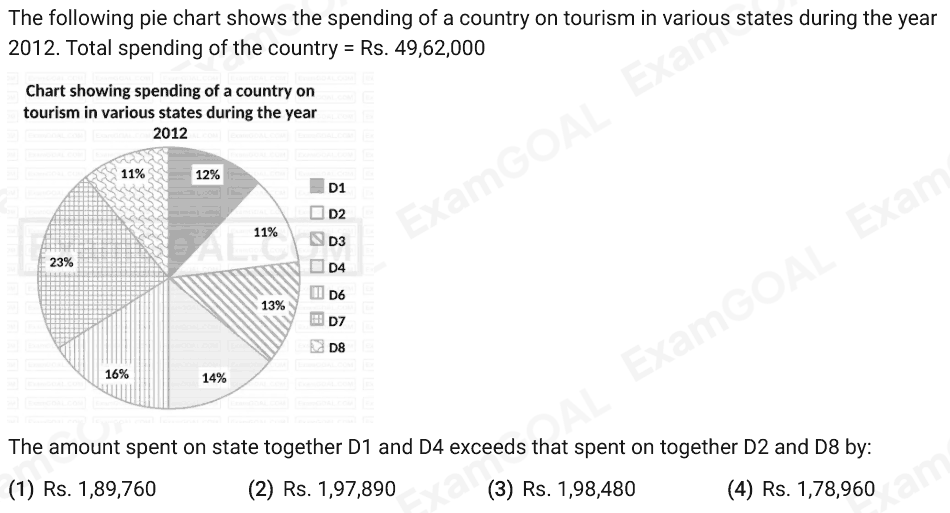
The following pie chart shows the spending of a country on tourism in various states during the year 2012. Total spending of the country = Rs. 49,62,000 The amount spent on state together D1 and D4 exceeds that spent on together D2 and D8 by:
Answer: C