182 questions asked across 4 exam years, newest first
प्रथम 47 प्राकृतिक संख्याओं के वर्गों का औसत ज्ञात कीजिए।
Answer: D
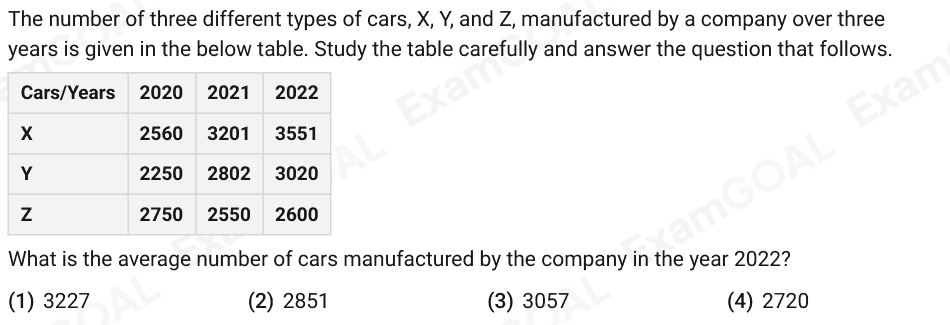
The number of three different types of cars, X, Y, and Z, manufactured by a company over three years is given in the below table. Study the table carefully and answer the question that follows. Cars/Years 2020 2021 2022 X 2560 3201 3551 Y 2250 2802 3020 Z 2750 2550 2600 What is the average number of cars manufactured by the company in the year 2022?
Answer: C
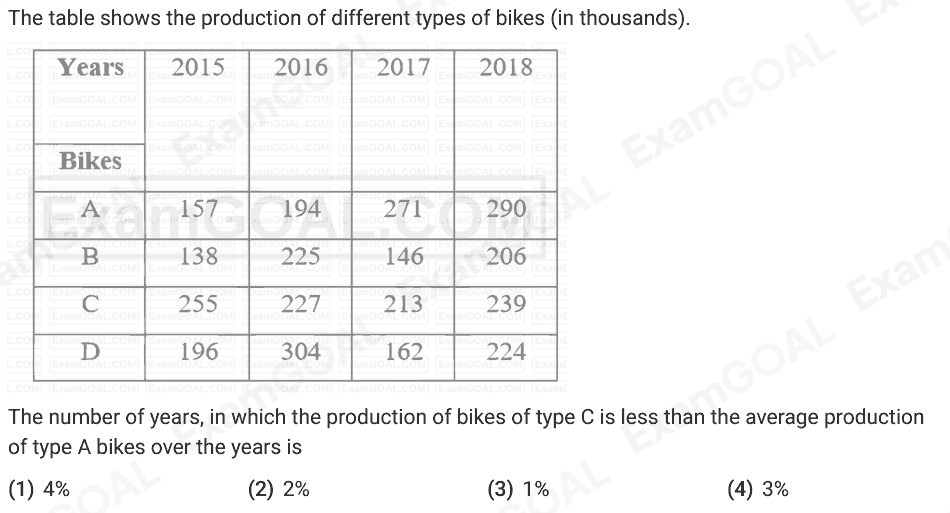
The table shows the production of different types of bikes (in thousands). The number of years, in which the production of bikes of type C is less than the average production of type A bikes over the years is
Answer: B
30 छात्रों के एक समूह ने एक टेस्ट दिया। 12 छात्रों का औसत स्कोर 62 है और बाकी छात्रों का औसत स्कोर 76 है। समूह का औसत स्कोर ज्ञात करें।
Answer: B
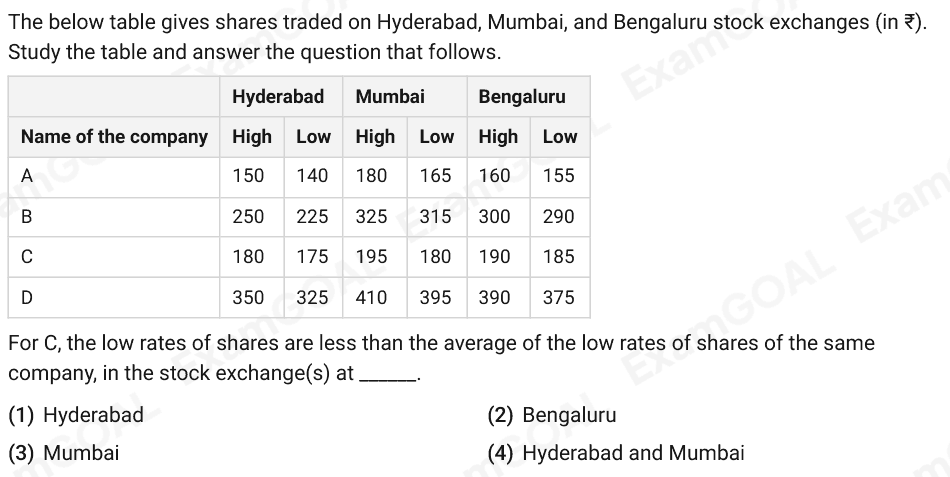
The below table gives shares traded on Hyderabad, Mumbai, and Bengaluru stock exchanges (in ₹). Study the table and answer the question that follows. Hyderabad Mumbai Bengaluru Name of the company High Low High Low High Low A 150 140 180 165 160 155 B 250 225 325 315 300 290 C 180 175 195 180 190 185 D 350 325 410 395 390 375 For C, the low rates of shares are less than the average of the low rates of shares of the same company, in the stock exchange(s) at ______.
Answer: A
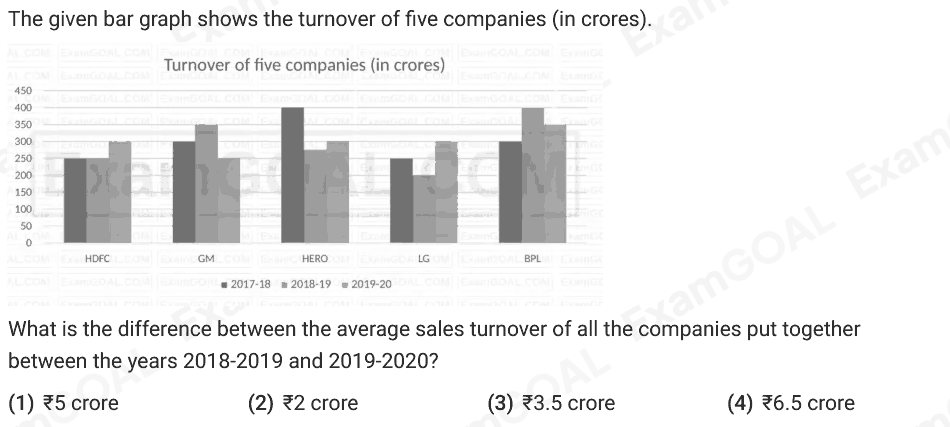
The given bar graph shows the turnover of five companies (in crores). What is the difference between the average sales turnover of all the companies put together between the years 2018-2019 and 2019-2020?
Answer: A
30 छात्रों वाली एक कक्षा के सभी छात्रों ने एक टेस्ट दिया। 12 छात्रों का औसत स्कोर 62 है और बाकी छात्रों का औसत स्कोर 72 है। कक्षा का औसत स्कोर ज्ञात करें।
Answer: B
12 संख्याओं का औसत 48 है। पहली 5 संख्याओं का औसत 45 है और अगली 4 संख्याओं का औसत 52 है। यदि 10वीं संख्या, 11वीं संख्या से 10 कम है और 12वीं संख्या से 5 अधिक है, तो 11वीं संख्या और 12वीं संख्या का औसत क्या है?
Answer: A
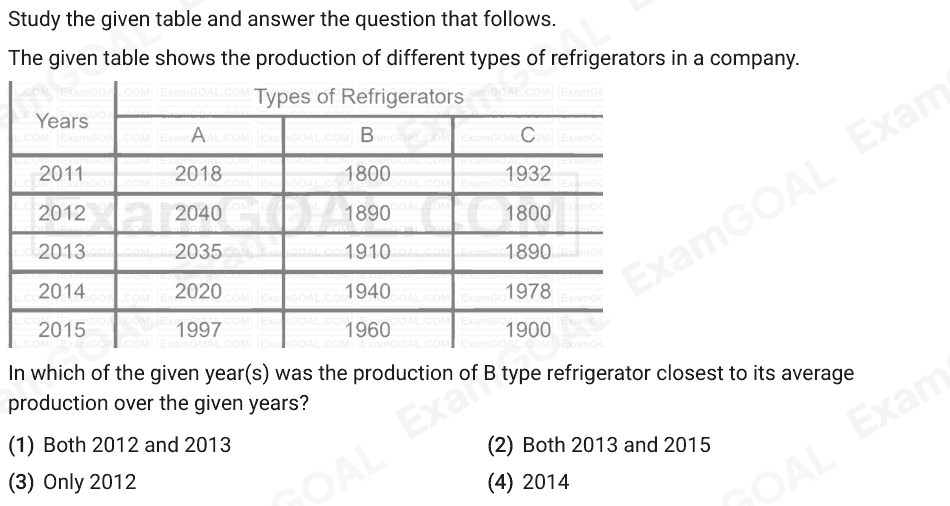
Study the given table and answer the question that follows. The given table shows the production of different types of refrigerators in a company. In which of the given year(s) was the production of B type refrigerator closest to its average production over the given years?
Answer: A
प्रथम 46 प्राकृतिक संख्याओं के वर्गों का औसत ज्ञात कीजिए।
Answer: D
30 छात्रों के एक समूह ने एक टेस्ट दिया। 12 छात्रों का औसत स्कोर 62 है और बाकी छात्रों का औसत स्कोर भी 62 है। समूह का औसत स्कोर ज्ञात करें।
Answer: C
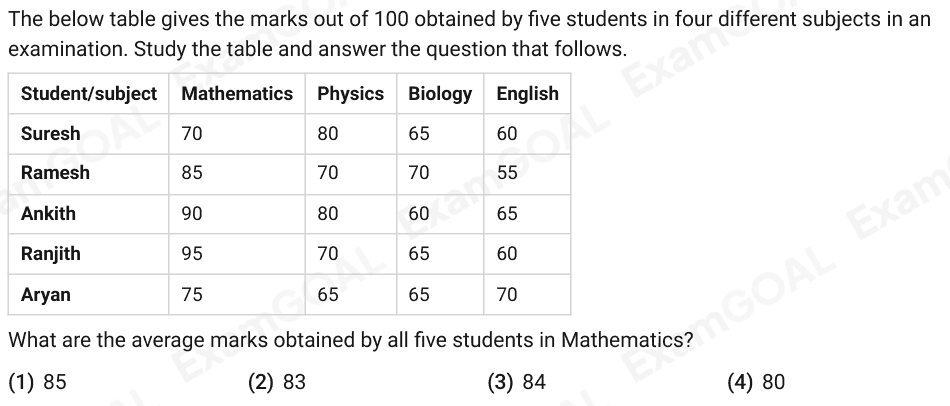
The below table gives the marks out of 100 obtained by five students in four different subjects in an examination. Study the table and answer the question that follows. Student/subject Mathematics Physics Biology English Suresh 70 80 65 60 Ramesh 85 70 70 55 Ankith 90 80 60 65 Ranjith 95 70 65 60 Aryan 75 65 65 70 What are the average marks obtained by all five students in Mathematics?
Answer: B
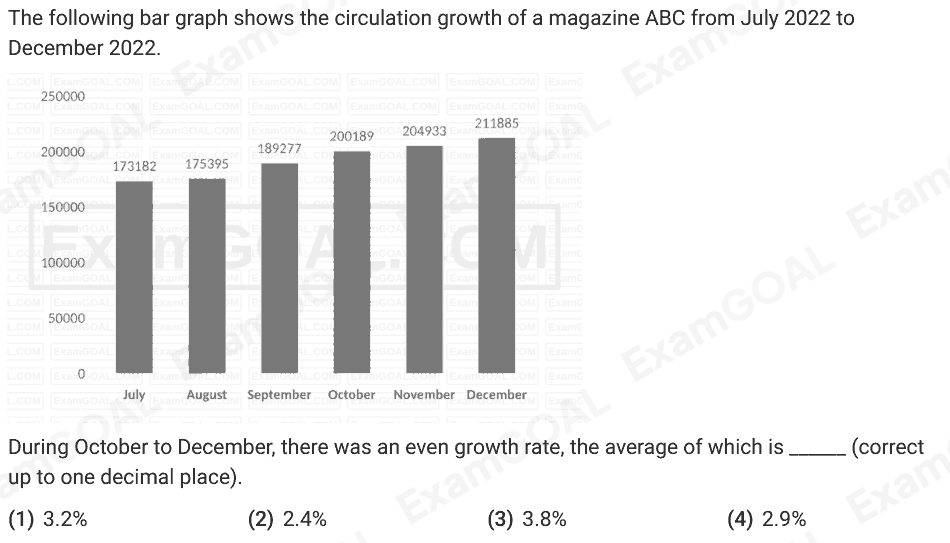
The following bar graph shows the circulation growth of a magazine ABC from July 2022 to December 2022. During October to December, there was an even growth rate, the average of which is ______ (correct up to one decimal place).
Answer: D
50 और 76 के बीच आने वाली अभाज्य संख्याओं का औसत ज्ञात करें।
Answer: A
30 छात्रों वाली एक कक्षा के सभी छात्रों ने एक टेस्ट दिया। 12 छात्रों का औसत स्कोर 62 है और बाकी छात्रों का औसत स्कोर 74 है। कक्षा का औसत स्कोर ज्ञात करें।
Answer: C
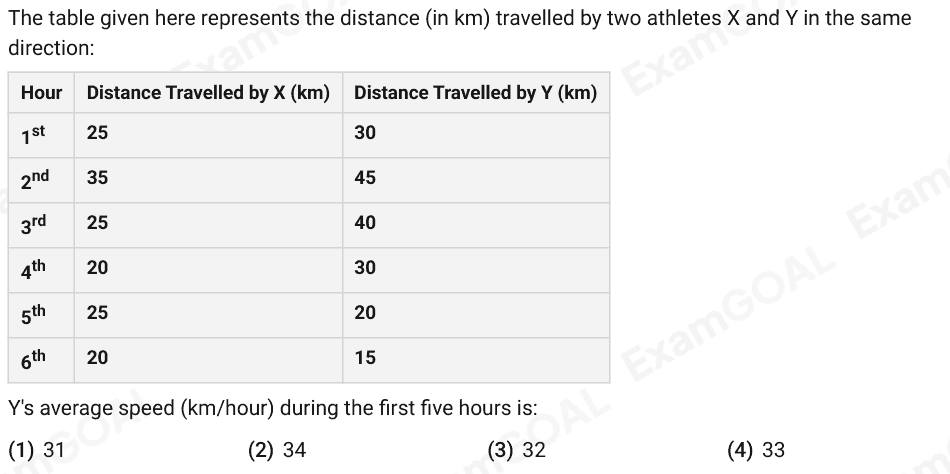
The table given here represents the distance (in km) travelled by two athletes X and Y in the same direction: Hour Distance Travelled by X (km) Distance Travelled by Y (km) 1st 25 30 2nd 35 45 3rd 25 40 4th 20 30 5th 25 20 6th 20 15 Y's average speed (km/hour) during the first five hours is:
Answer: D
A bus travels of the distance initially at a speed of 40 km/h, the next of the distance 50 km/h, and the final of the distance at 60 km/h. Find the average speed of the bus for the entire journey. (Rounded off to two decimal places)
Answer: A
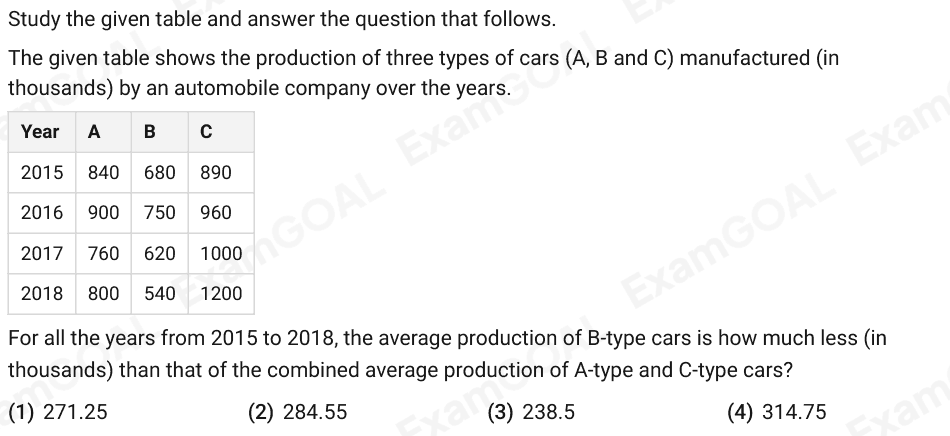
Study the given table and answer the question that follows. The given table shows the production of three types of cars (A, B and C) manufactured (in thousands) by an automobile company over the years. Year A B C 2015 840 680 890 2016 900 750 960 2017 760 620 1000 2018 800 540 1200 For all the years from 2015 to 2018, the average production of B-type cars is how much less (in thousands) than that of the combined average production of A-type and C-type cars?
Answer: A
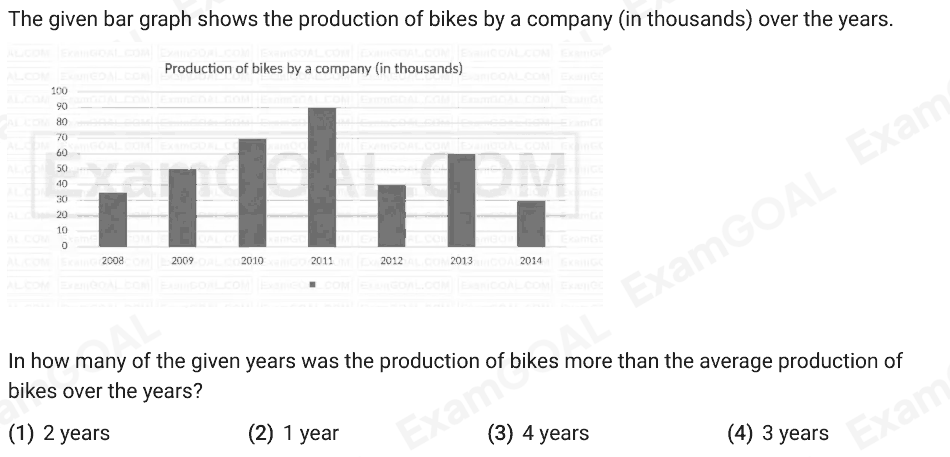
The given bar graph shows the production of bikes by a company (in thousands) over the years. In how many of the given years was the production of bikes more than the average production of bikes over the years?
Answer: D
प्रथम 45 प्राकृतिक संख्याओं के वर्गों का औसत ज्ञात कीजिए।
Answer: B
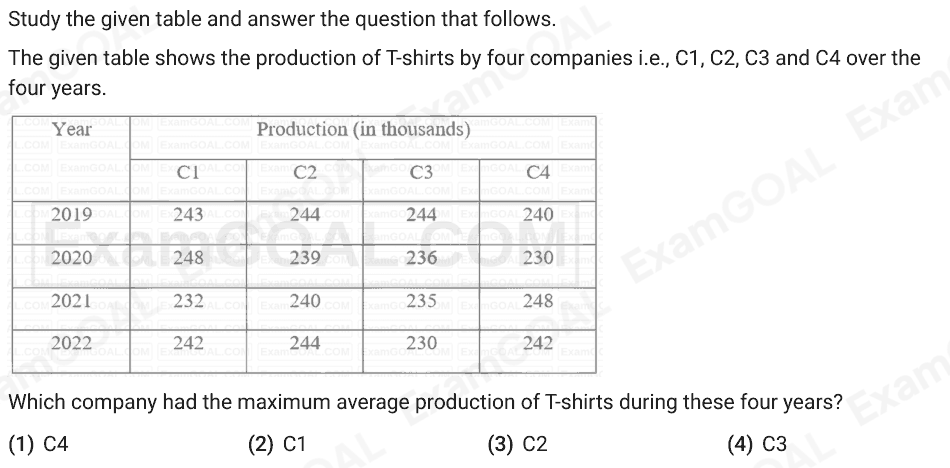
Study the given table and answer the question that follows. The given table shows the production of T-shirts by four companies i.e., C1, C2, C3 and C4 over the four years. Which company had the maximum average production of T-shirts during these four years?
Answer: C