59 questions asked across 4 exam years, newest first
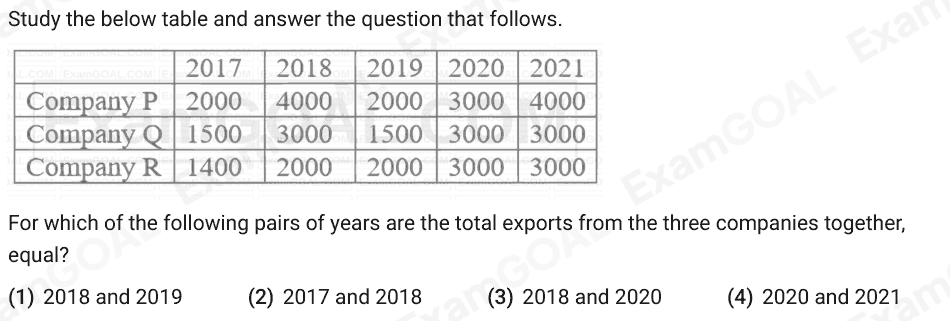
Study the below table and answer the question that follows. For which of the following pairs of years are the total exports from the three companies together, equal?
Answer: C
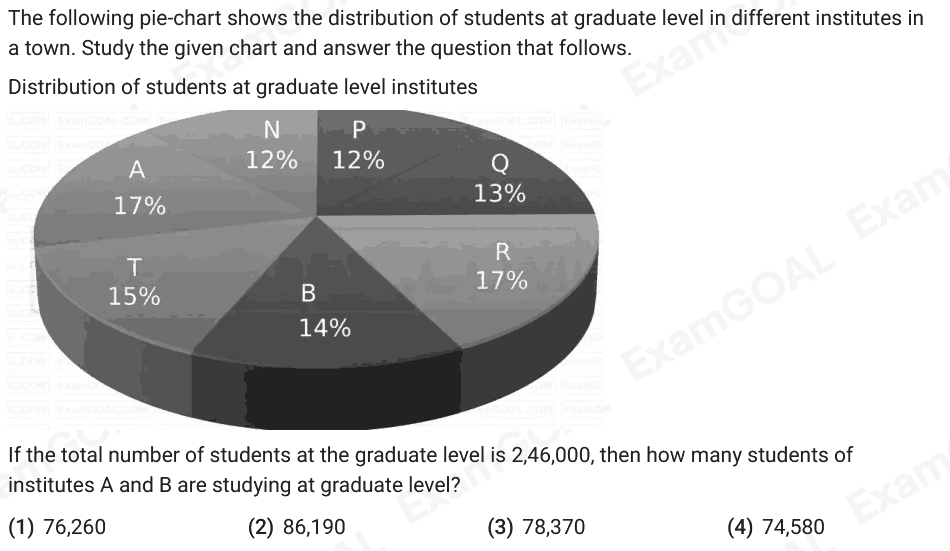
The following pie-chart shows the distribution of students at graduate level in different institutes in a town. Study the given chart and answer the question that follows. Distribution of students at graduate level institutes If the total number of students at the graduate level is 2,46,000, then how many students of institutes A and B are studying at graduate level?
Answer: A
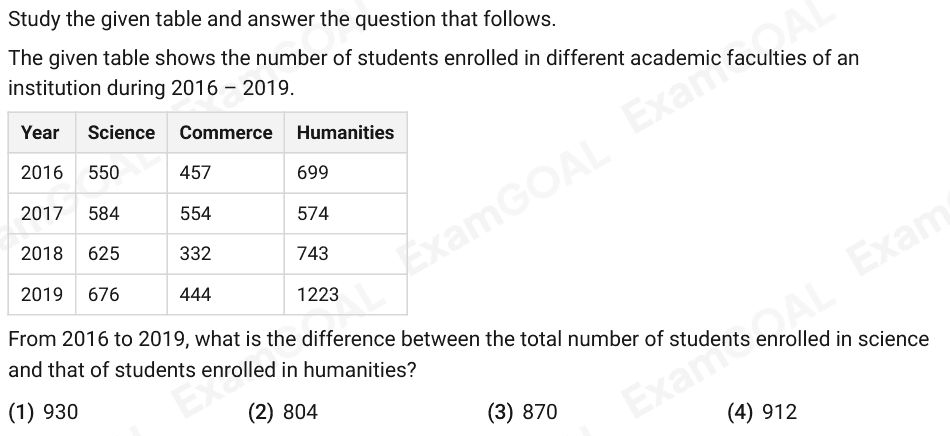
Study the given table and answer the question that follows. The given table shows the number of students enrolled in different academic faculties of an institution during 2016 – 2019. Year Science Commerce Humanities 2016 550 457 699 2017 584 554 574 2018 625 332 743 2019 676 444 1223 From 2016 to 2019, what is the difference between the total number of students enrolled in science and that of students enrolled in humanities?
Answer: B
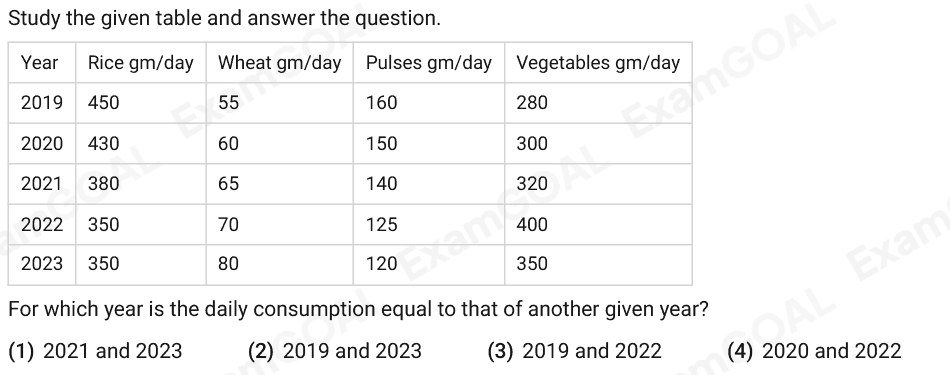
Study the given table and answer the question. Year Rice gm/day Wheat gm/day Pulses gm/day Vegetables gm/day 2019 450 55 160 280 2020 430 60 150 300 2021 380 65 140 320 2022 350 70 125 400 2023 350 80 120 350 For which year is the daily consumption equal to that of another given year?
Answer: C
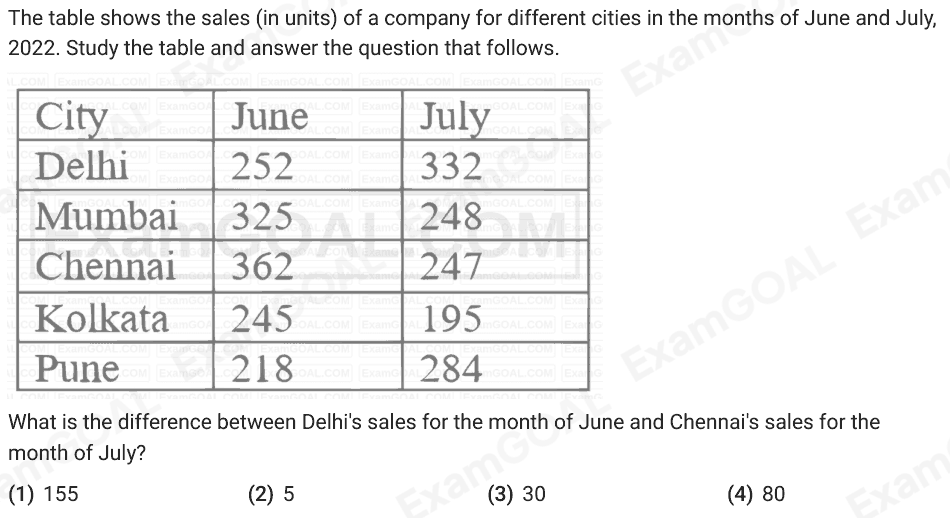
The table shows the sales (in units) of a company for different cities in the months of June and July, 2022. Study the table and answer the question that follows. What is the difference between Delhi's sales for the month of June and Chennai's sales for the month of July?
Answer: B
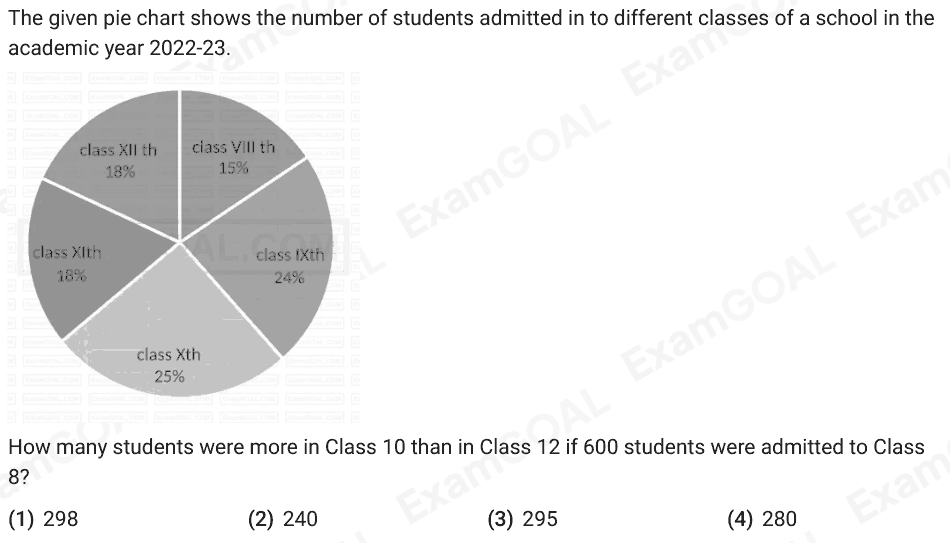
The given pie chart shows the number of students admitted in to different classes of a school in the academic year 2022-23. How many students were more in Class 10 than in Class 12 if 600 students were admitted to Class 8?
Answer: D
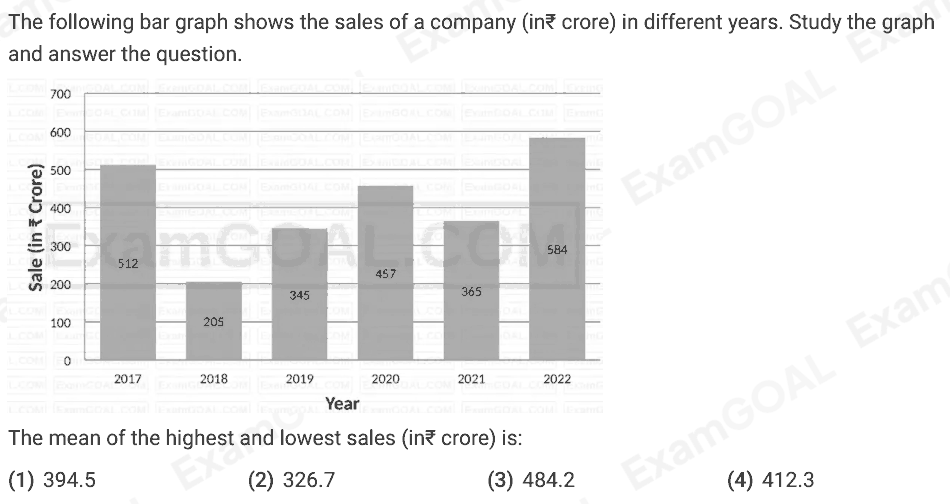
The following bar graph shows the sales of a company (in₹ crore) in different years. Study the graph and answer the question. The mean of the highest and lowest sales (in₹ crore) is:
Answer: A
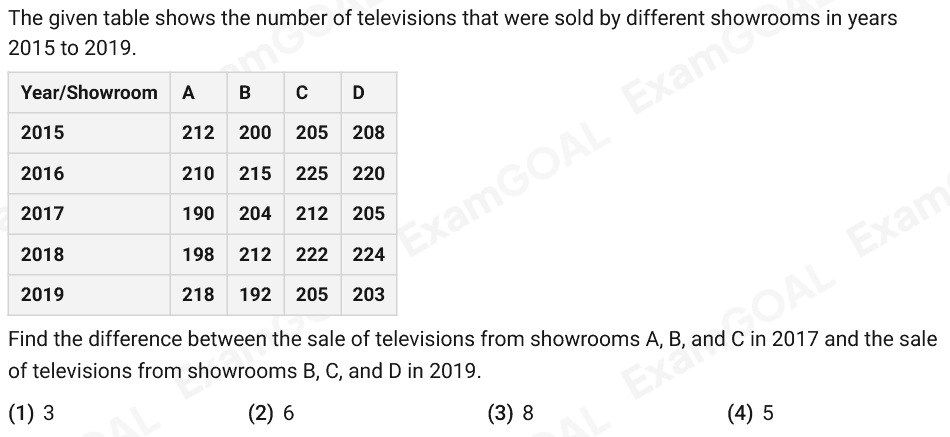
The given table shows the number of televisions that were sold by different showrooms in years 2015 to 2019. Year/Showroom A B C D 2015 212 200 205 208 2016 210 215 225 220 2017 190 204 212 205 2018 198 212 222 224 2019 218 192 205 203 Find the difference between the sale of televisions from showrooms A, B, and C in 2017 and the sale of televisions from showrooms B, C, and D in 2019.
Answer: B
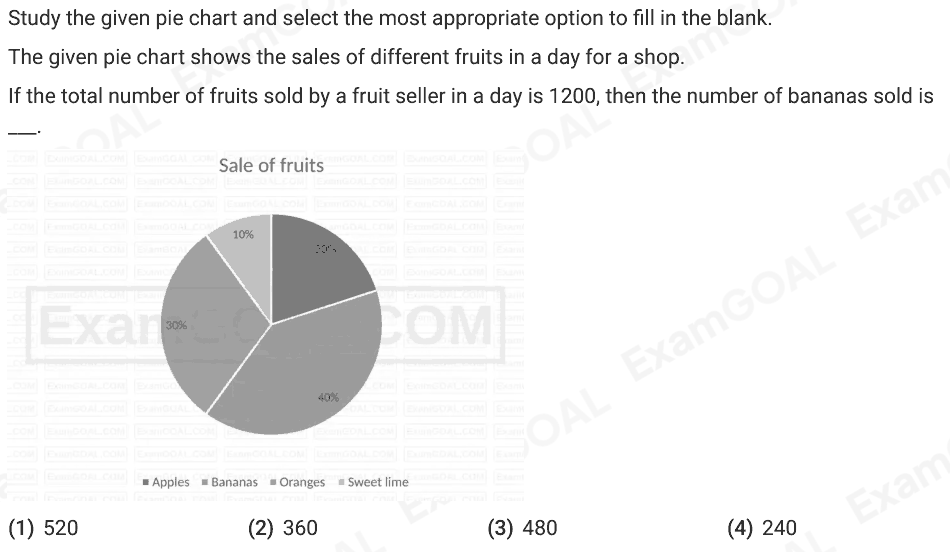
Study the given pie chart and select the most appropriate option to fill in the blank. The given pie chart shows the sales of different fruits in a day for a shop. If the total number of fruits sold by a fruit seller in a day is 1200, then the number of bananas sold is ___.
Answer: C
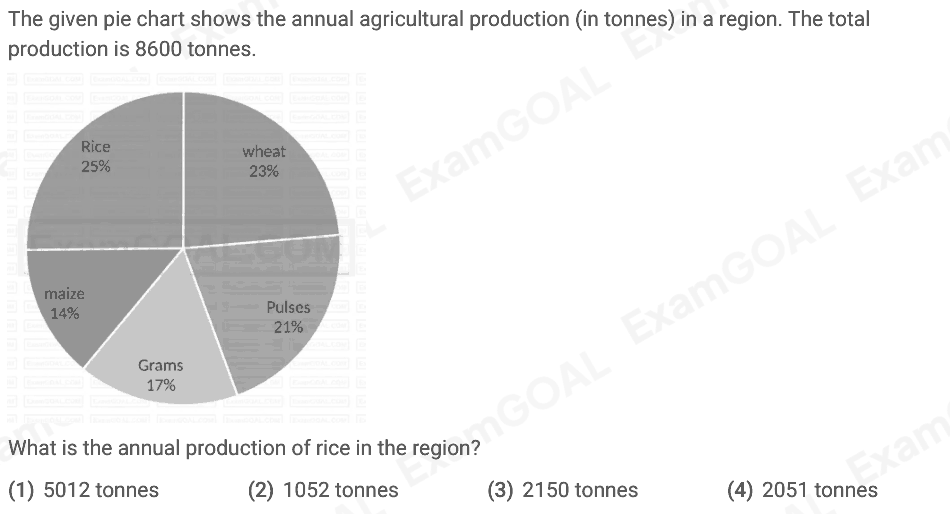
The given pie chart shows the annual agricultural production (in tonnes) in a region. The total production is 8600 tonnes. What is the annual production of rice in the region?
Answer: C
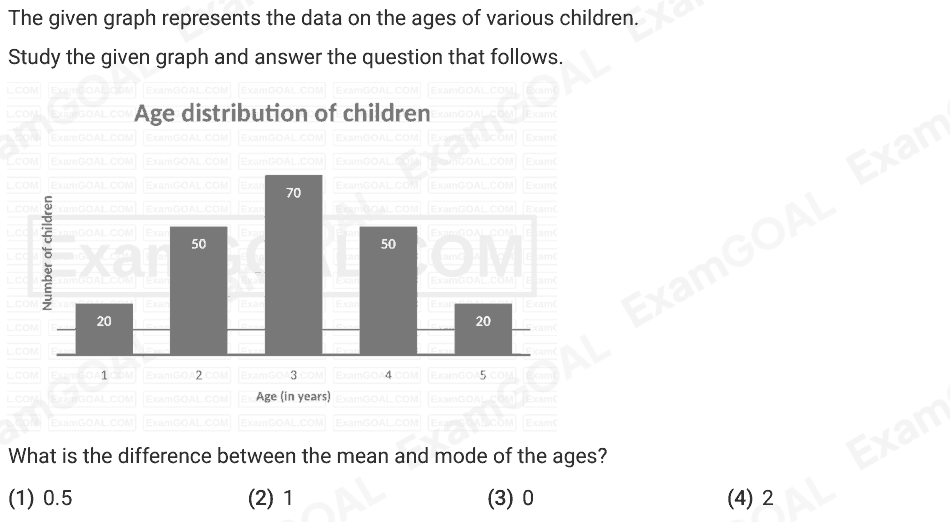
The given graph represents the data on the ages of various children. Study the given graph and answer the question that follows. What is the difference between the mean and mode of the ages?
Answer: C
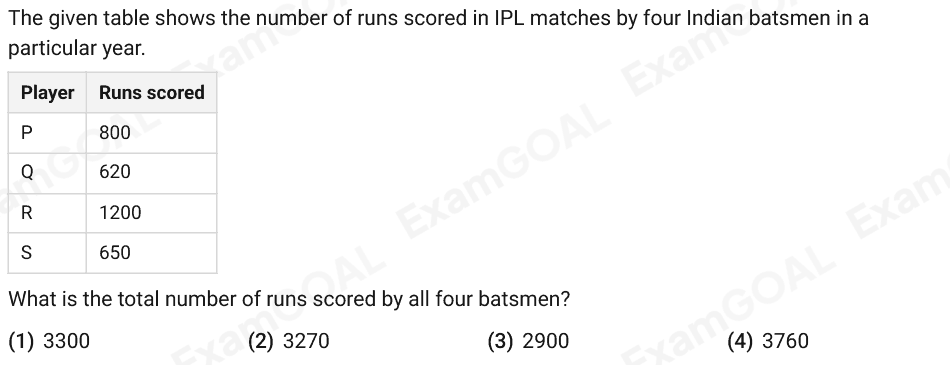
The given table shows the number of runs scored in IPL matches by four Indian batsmen in a particular year. Player Runs scored P 800 Q 620 R 1200 S 650 What is the total number of runs scored by all four batsmen?
Answer: B
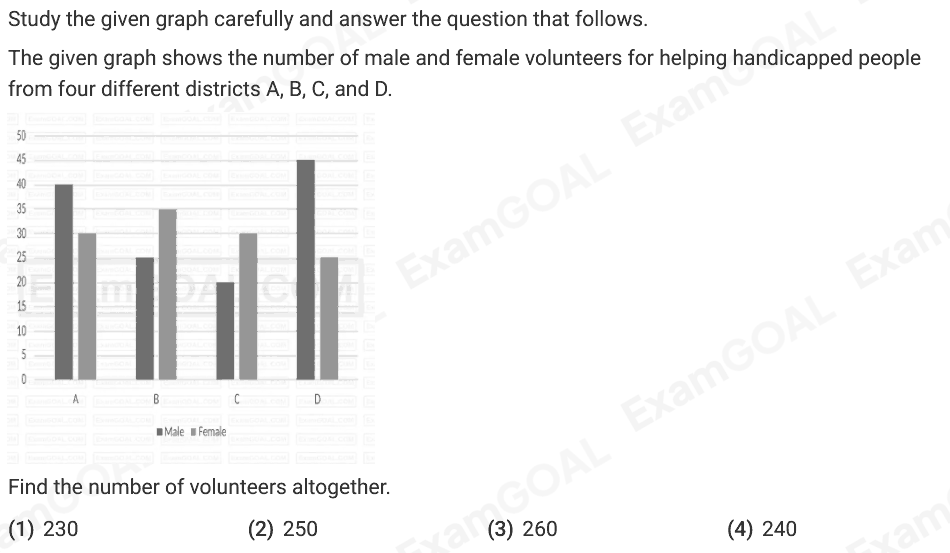
Study the given graph carefully and answer the question that follows. The given graph shows the number of male and female volunteers for helping handicapped people from four different districts A, B, C, and D. Find the number of volunteers altogether.
Answer: B
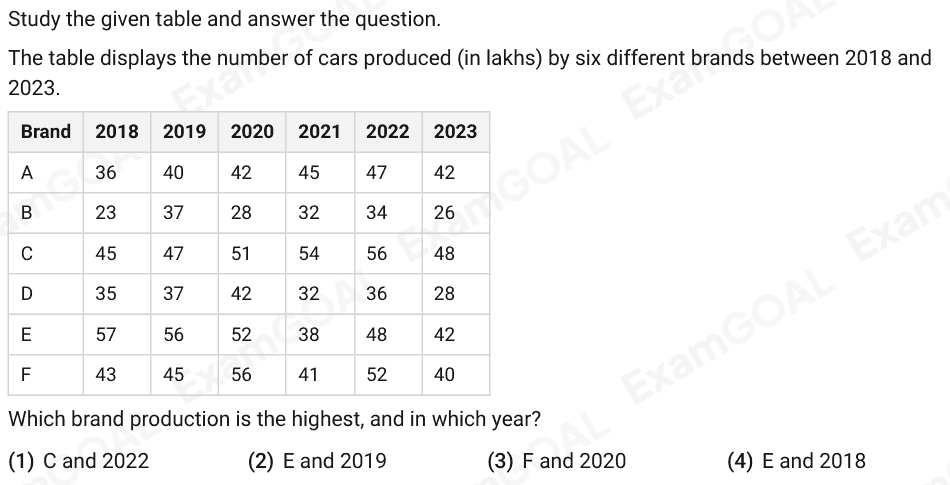
Study the given table and answer the question. The table displays the number of cars produced (in lakhs) by six different brands between 2018 and 2023. Brand 2018 2019 2020 2021 2022 2023 A 36 40 42 45 47 42 B 23 37 28 32 34 26 C 45 47 51 54 56 48 D 35 37 42 32 36 28 E 57 56 52 38 48 42 F 43 45 56 41 52 40 Which brand production is the highest, and in which year?
Answer: D
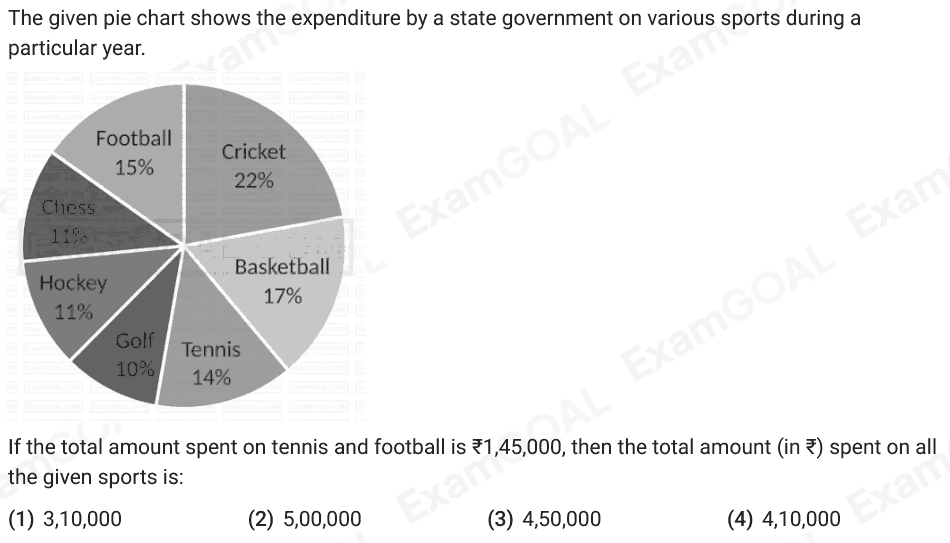
The given pie chart shows the expenditure by a state government on various sports during a particular year. If the total amount spent on tennis and football is ₹1,45,000, then the total amount (in ₹) spent on all the given sports is:
Answer: B
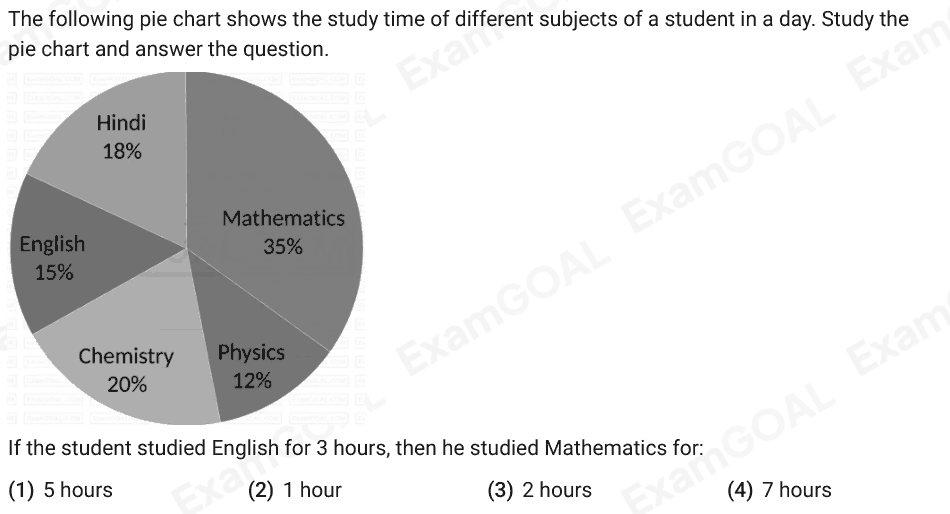
The following pie chart shows the study time of different subjects of a student in a day. Study the pie chart and answer the question. If the student studied English for 3 hours, then he studied Mathematics for:
Answer: D
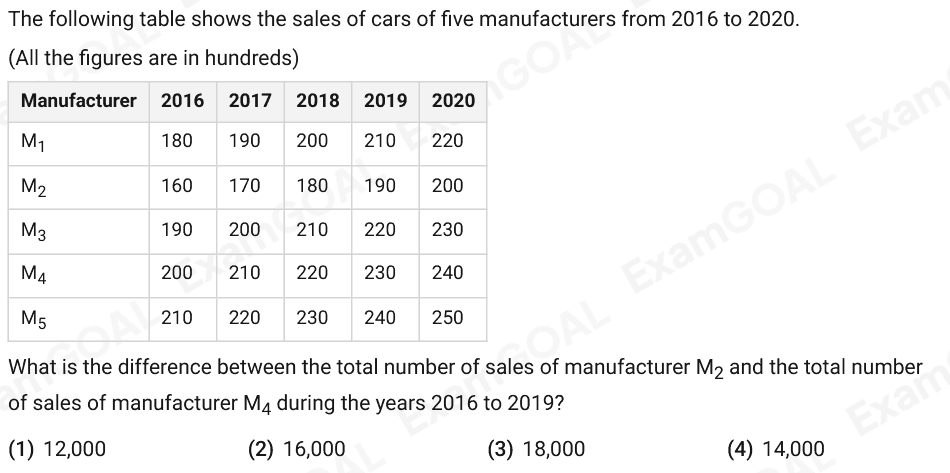
The following table shows the sales of cars of five manufacturers from 2016 to 2020. (All the figures are in hundreds) Manufacturer 2016 2017 2018 2019 2020 M1 180 190 200 210 220 M2 160 170 180 190 200 M3 190 200 210 220 230 M4 200 210 220 230 240 M5 210 220 230 240 250 What is the difference between the total number of sales of manufacturer M2 and the total number of sales of manufacturer M4 during the years 2016 to 2019?
Answer: B
What is the value of D, if A : C = B : D in the given table? A B C D 25 40 30 ?

Answer: D
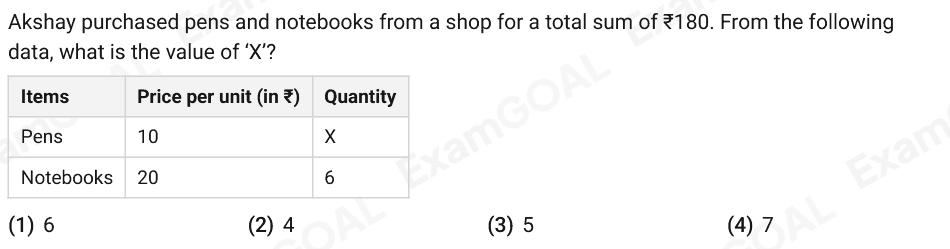
Akshay purchased pens and notebooks from a shop for a total sum of ₹180. From the following data, what is the value of ‘X’? Items Price per unit (in ₹) Quantity Pens 10 X Notebooks 20 6
Answer: A
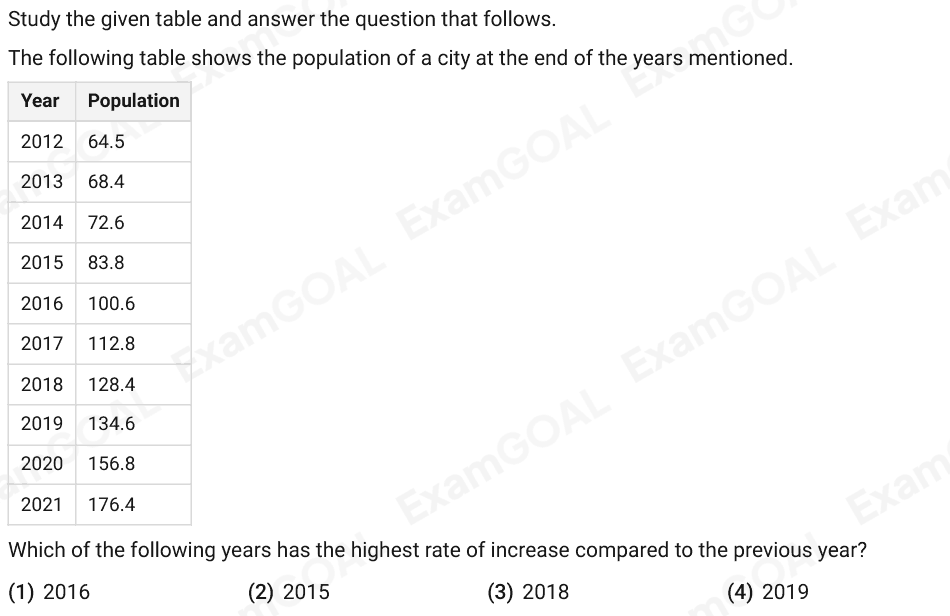
Study the given table and answer the question that follows. The following table shows the population of a city at the end of the years mentioned. Year Population 2012 64.5 2013 68.4 2014 72.6 2015 83.8 2016 100.6 2017 112.8 2018 128.4 2019 134.6 2020 156.8 2021 176.4 Which of the following years has the highest rate of increase compared to the previous year?
Answer: A