59 questions asked across 4 exam years, newest first
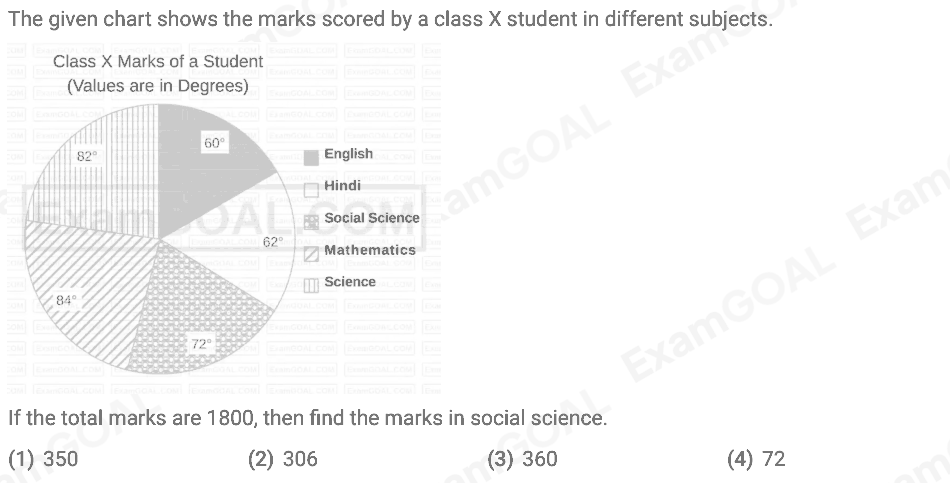
The given chart shows the marks scored by a class X student in different subjects. If the total marks are 1800, then find the marks in social science.
Answer: C
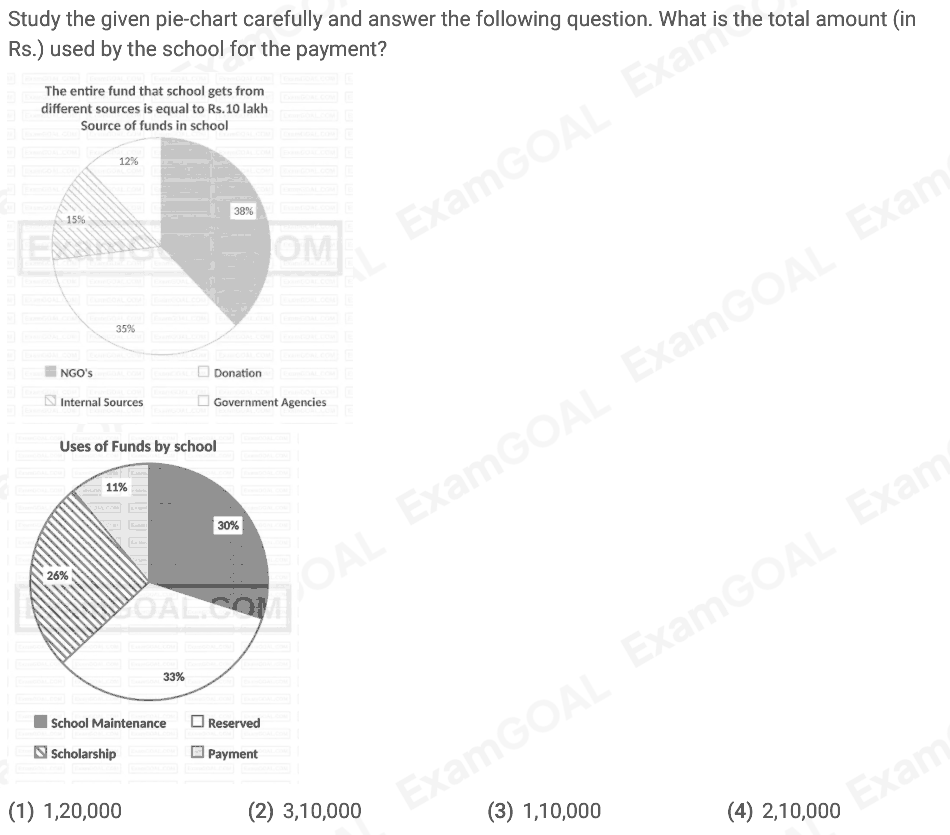
Study the given pie-chart carefully and answer the following question. What is the total amount (in Rs.) used by the school for the payment?
Answer: C
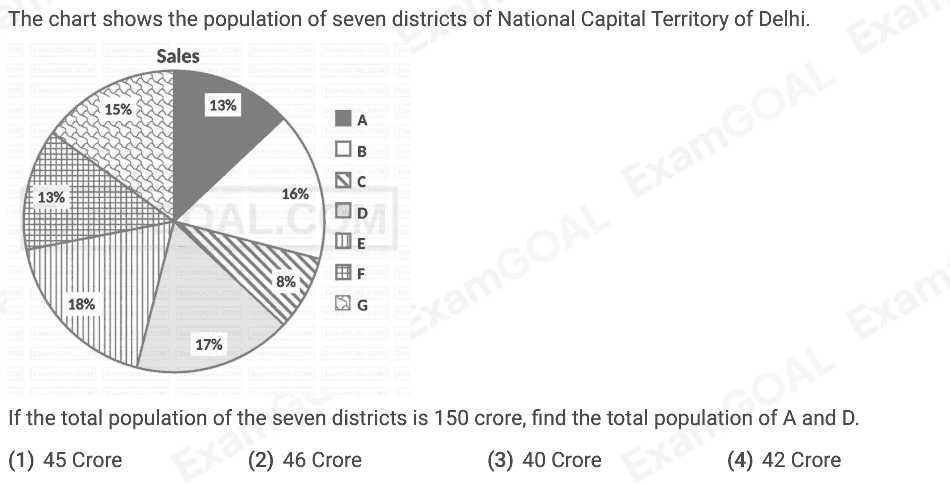
The chart shows the population of seven districts of National Capital Territory of Delhi. If the total population of the seven districts is 150 crore, find the total population of A and D.
Answer: A
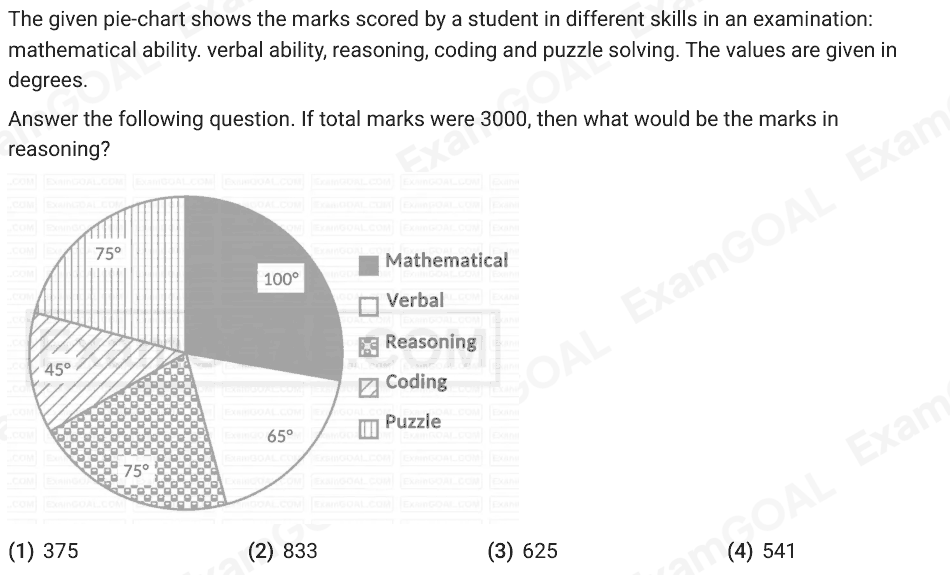
The given pie-chart shows the marks scored by a student in different skills in an examination: mathematical ability. verbal ability, reasoning, coding and puzzle solving. The values are given in degrees. Answer the following question. If total marks were 3000, then what would be the marks in reasoning?
Answer: C
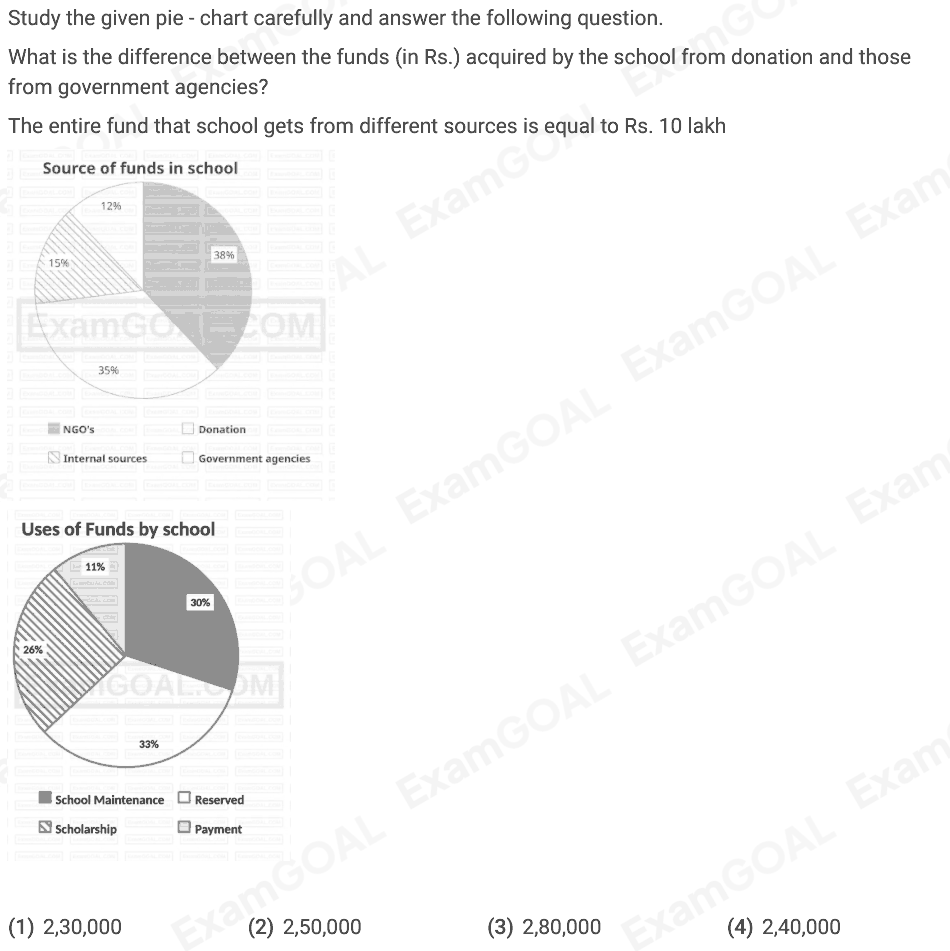
Study the given pie - chart carefully and answer the following question. What is the difference between the funds (in Rs.) acquired by the school from donation and those from government agencies? The entire fund that school gets from different sources is equal to Rs. 10 lakh
Answer: A
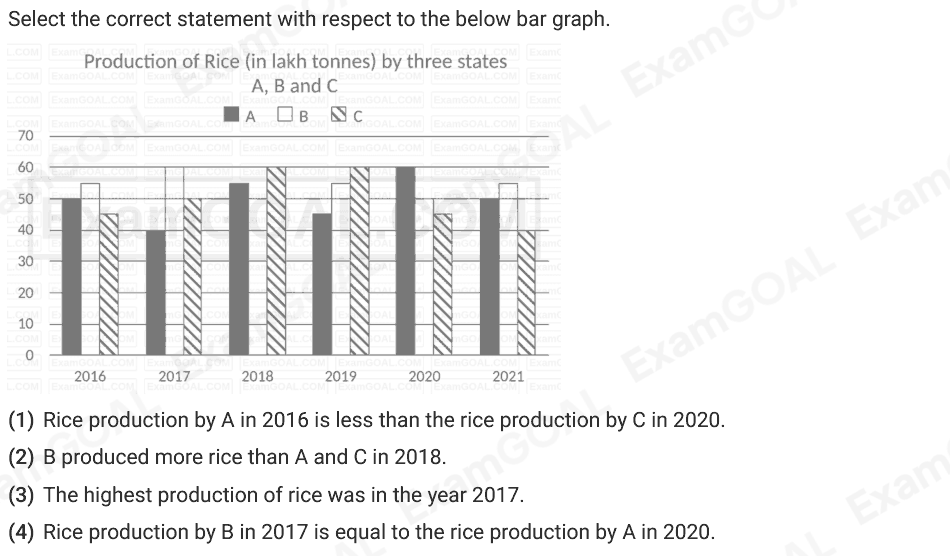
Select the correct statement with respect to the below bar graph.
Answer: D
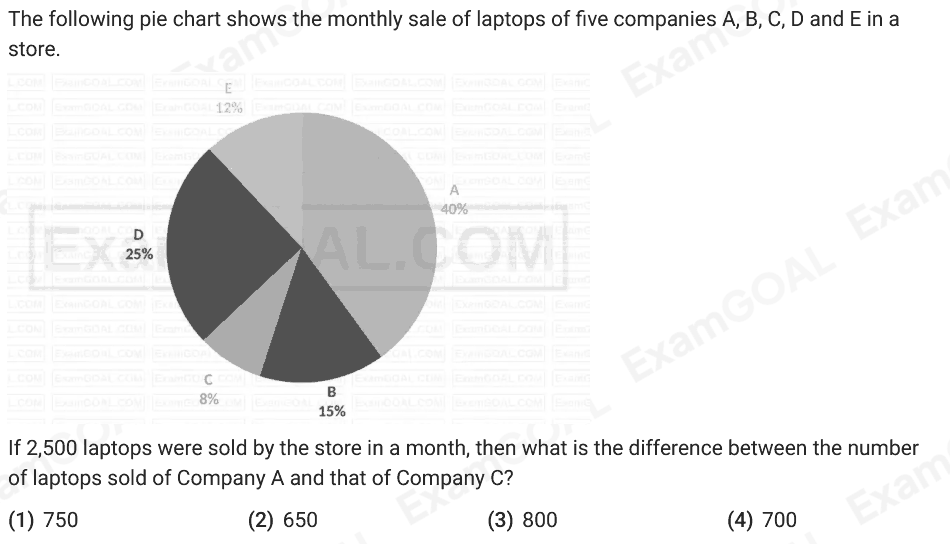
The following pie chart shows the monthly sale of laptops of five companies A, B, C, D and E in a store. If 2,500 laptops were sold by the store in a month, then what is the difference between the number of laptops sold of Company A and that of Company C?
Answer: C
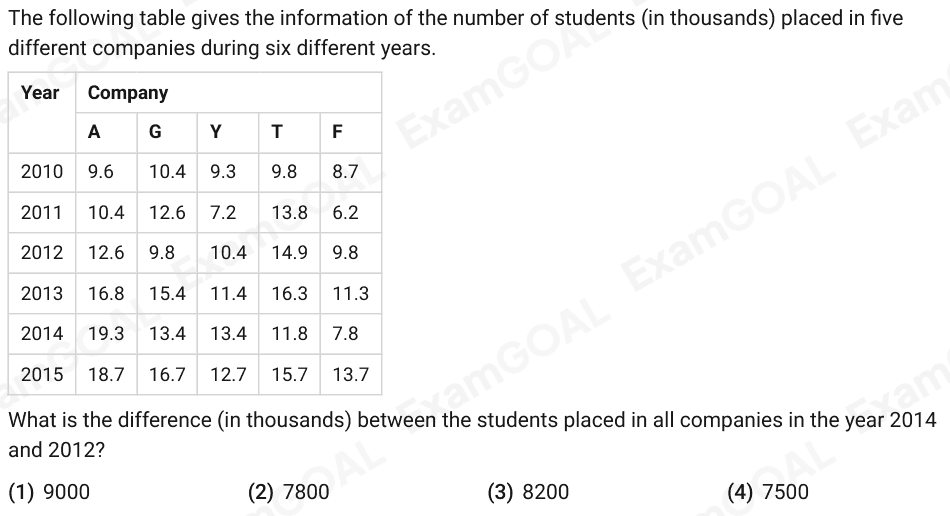
The following table gives the information of the number of students (in thousands) placed in five different companies during six different years. Year Company A G Y T F 2010 9.6 10.4 9.3 9.8 8.7 2011 10.4 12.6 7.2 13.8 6.2 2012 12.6 9.8 10.4 14.9 9.8 2013 16.8 15.4 11.4 16.3 11.3 2014 19.3 13.4 13.4 11.8 7.8 2015 18.7 16.7 12.7 15.7 13.7 What is the difference (in thousands) between the students placed in all companies in the year 2014 and 2012?
Answer: C
सिपाही राम, चोर सोमेश से 225 m पीछे है। एक मिनट में, राम 50 m और सोमेश 30 m दौड़ता है। सिपाही राम, चोर सोमेश को कितने समय में पकड़ लेगा?
Answer: D
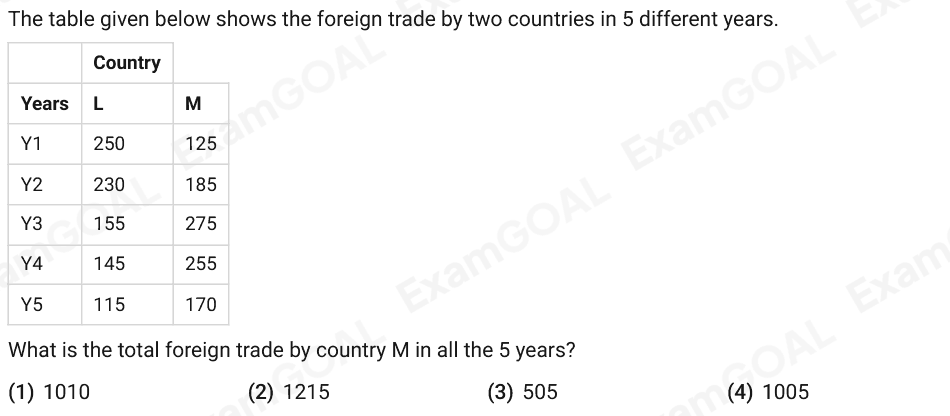
The table given below shows the foreign trade by two countries in 5 different years. Country Years L M Y1 250 125 Y2 230 185 Y3 155 275 Y4 145 255 Y5 115 170 What is the total foreign trade by country M in all the 5 years?
Answer: A
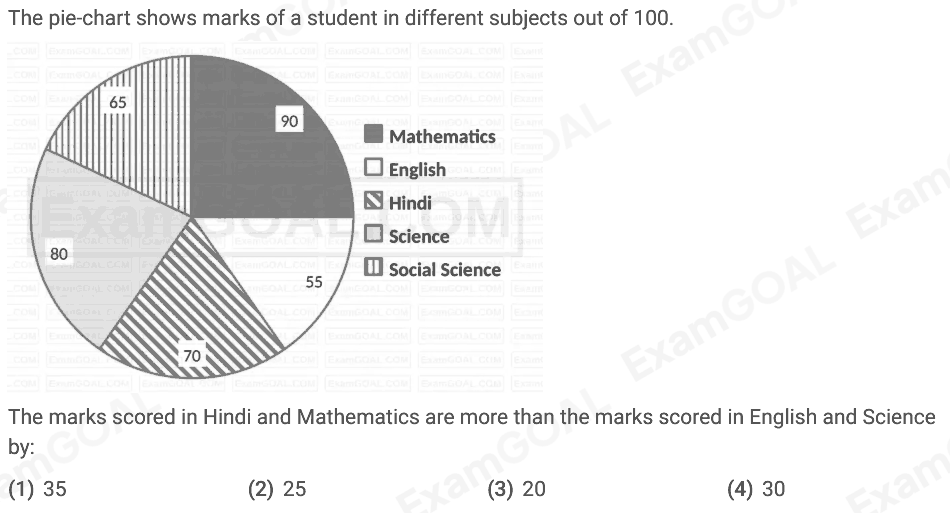
The pie-chart shows marks of a student in different subjects out of 100. The marks scored in Hindi and Mathematics are more than the marks scored in English and Science by:
Answer: B
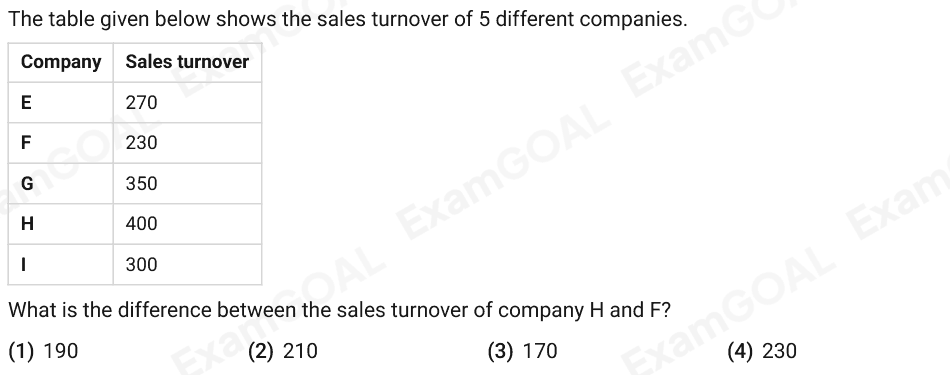
The table given below shows the sales turnover of 5 different companies. Company Sales turnover E 270 F 230 G 350 H 400 I 300 What is the difference between the sales turnover of company H and F?
Answer: C
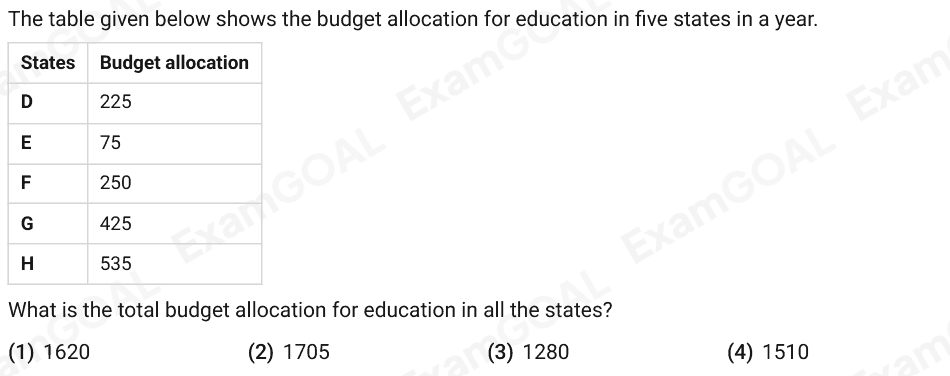
The table given below shows the budget allocation for education in five states in a year. States Budget allocation D 225 E 75 F 250 G 425 H 535 What is the total budget allocation for education in all the states?
Answer: D
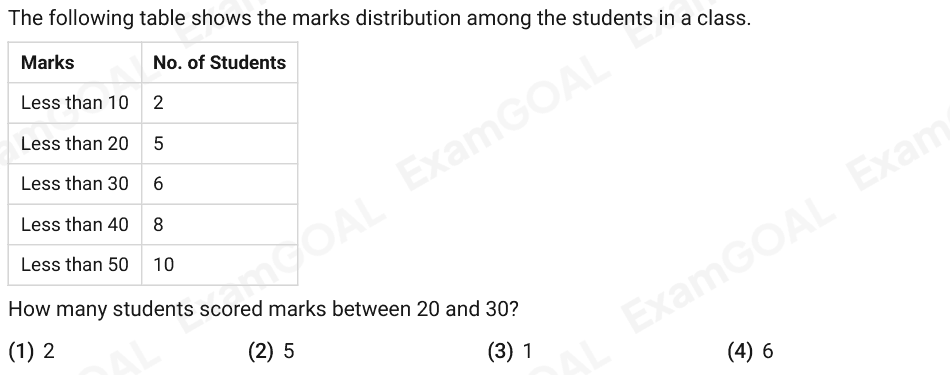
The following table shows the marks distribution among the students in a class. Marks No. of Students Less than 10 2 Less than 20 5 Less than 30 6 Less than 40 8 Less than 50 10 How many students scored marks between 20 and 30?
Answer: C
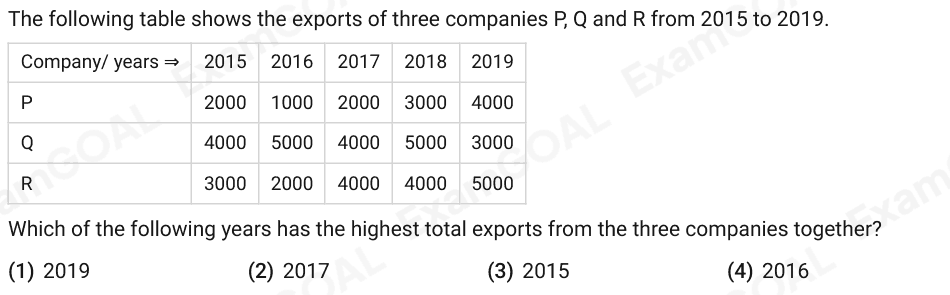
The following table shows the exports of three companies P, Q and R from 2015 to 2019. Company/ years ⇒ 2015 2016 2017 2018 2019 P 2000 1000 2000 3000 4000 Q 4000 5000 4000 5000 3000 R 3000 2000 4000 4000 5000 Which of the following years has the highest total exports from the three companies together?
Answer: A
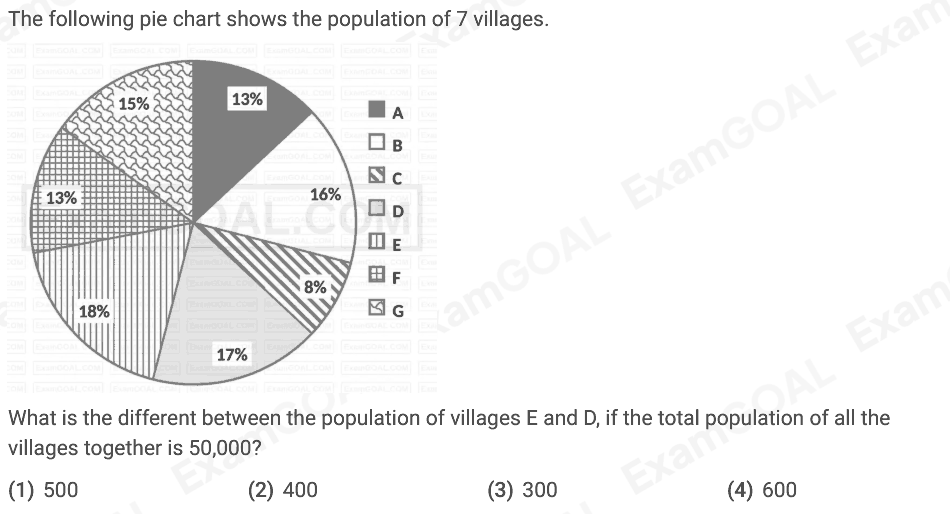
The following pie chart shows the population of 7 villages. What is the different between the population of villages E and D, if the total population of all the villages together is 50,000?
Answer: A
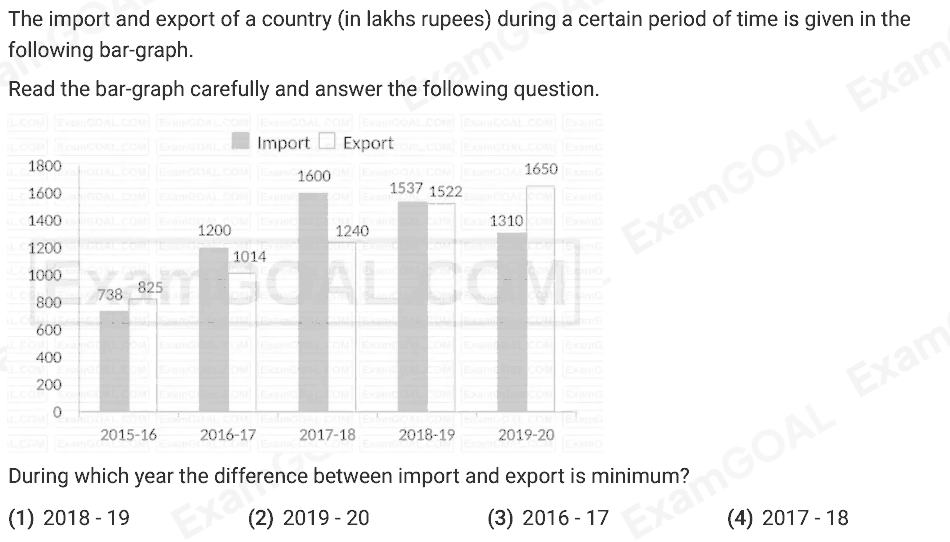
The import and export of a country (in lakhs rupees) during a certain period of time is given in the following bar-graph. Read the bar-graph carefully and answer the following question. During which year the difference between import and export is minimum?
Answer: A
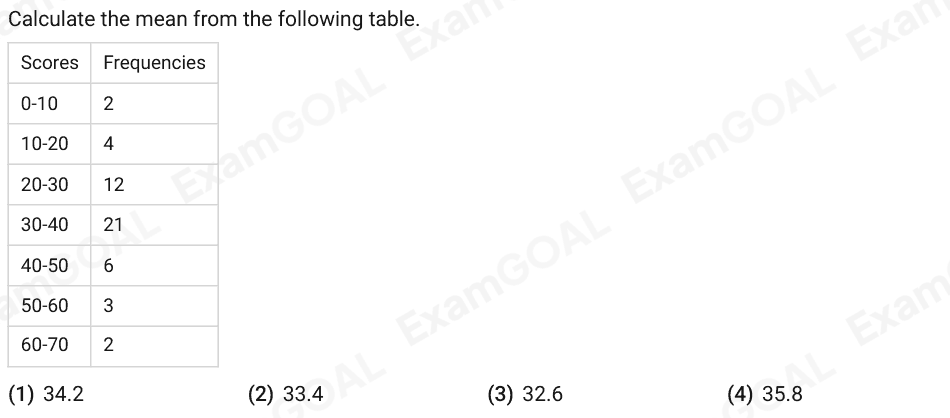
Calculate the mean from the following table. Scores Frequencies 0-10 2 10-20 4 20-30 12 30-40 21 40-50 6 50-60 3 60-70 2
Answer: B
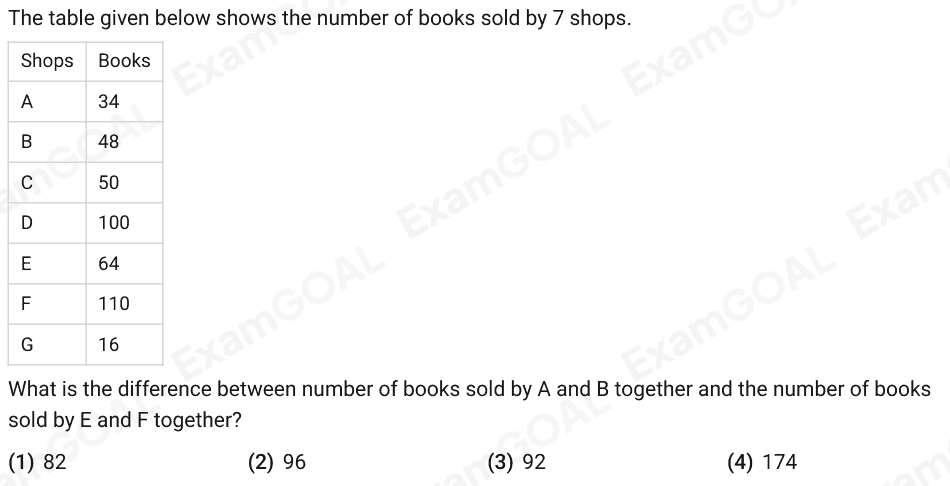
The table given below shows the number of books sold by 7 shops. Shops Books A 34 B 48 C 50 D 100 E 64 F 110 G 16 What is the difference between number of books sold by A and B together and the number of books sold by E and F together?
Answer: C
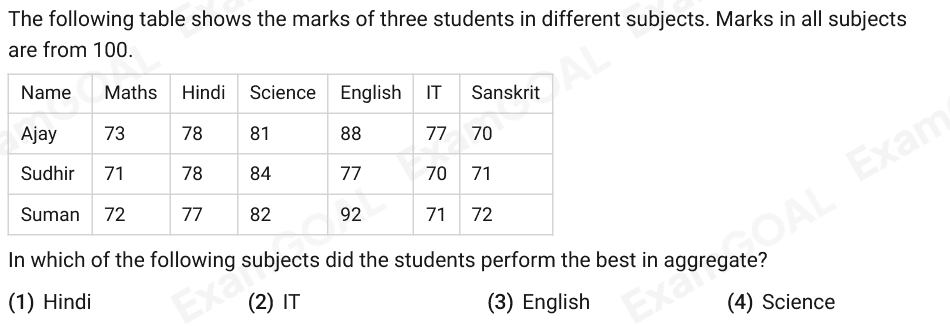
The following table shows the marks of three students in different subjects. Marks in all subjects are from 100. Name Maths Hindi Science English IT Sanskrit Ajay 73 78 81 88 77 70 Sudhir 71 78 84 77 70 71 Suman 72 77 82 92 71 72 In which of the following subjects did the students perform the best in aggregate?
Answer: C
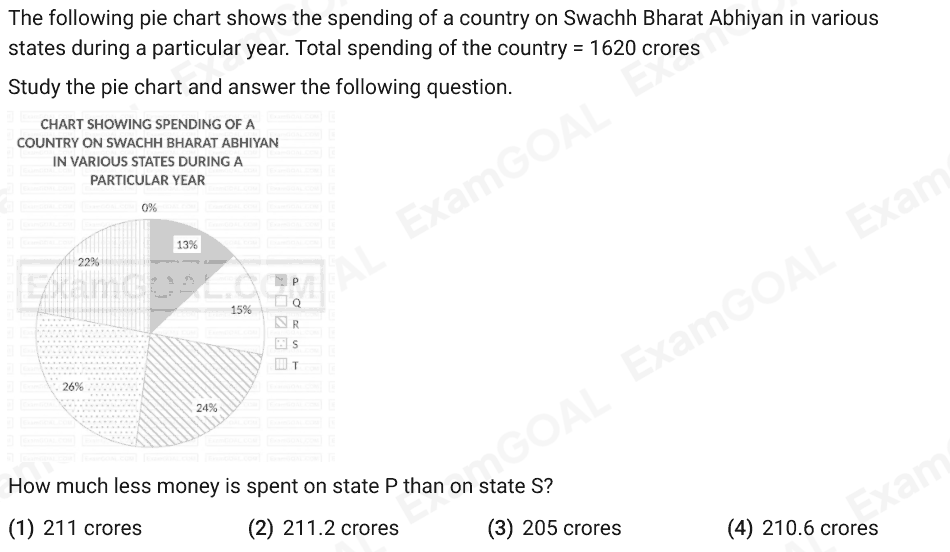
The following pie chart shows the spending of a country on Swachh Bharat Abhiyan in various states during a particular year. Total spending of the country = 1620 crores Study the pie chart and answer the following question. How much less money is spent on state P than on state S?
Answer: D
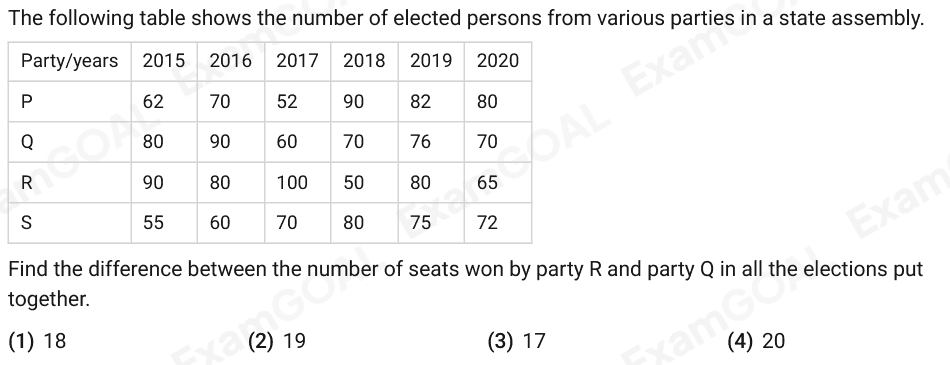
The following table shows the number of elected persons from various parties in a state assembly. Party/years 2015 2016 2017 2018 2019 2020 P 62 70 52 90 82 80 Q 80 90 60 70 76 70 R 90 80 100 50 80 65 S 55 60 70 80 75 72 Find the difference between the number of seats won by party R and party Q in all the elections put together.
Answer: B
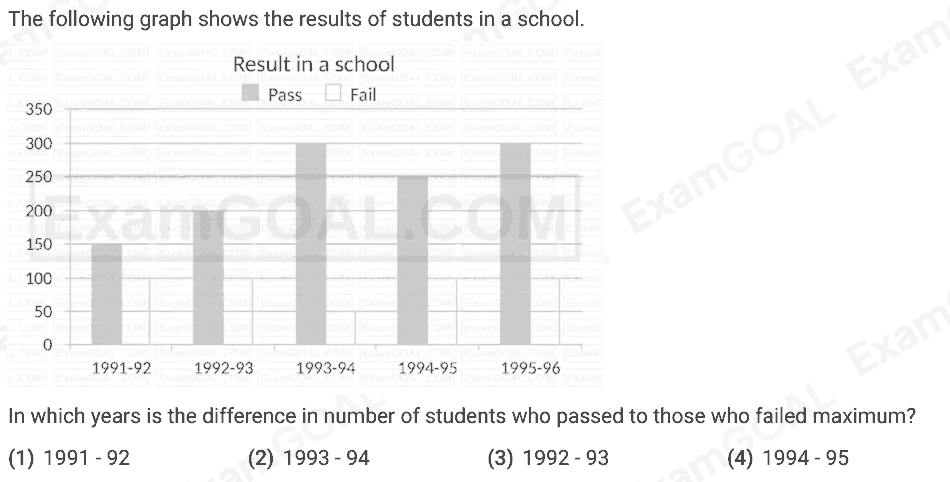
The following graph shows the results of students in a school. In which years is the difference in number of students who passed to those who failed maximum?
Answer: B
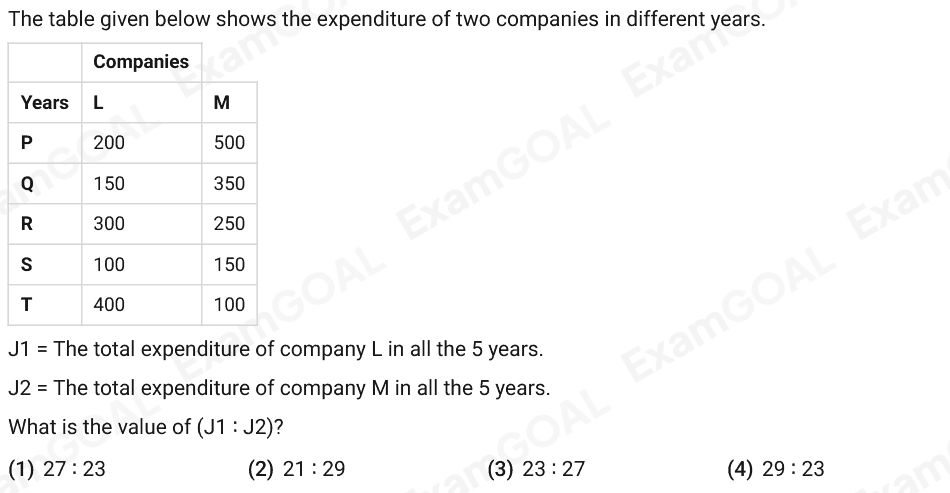
The table given below shows the expenditure of two companies in different years. Companies Years L M P 200 500 Q 150 350 R 300 250 S 100 150 T 400 100 J1 = The total expenditure of company L in all the 5 years. J2 = The total expenditure of company M in all the 5 years. What is the value of (J1 ∶ J2)?
Answer: C
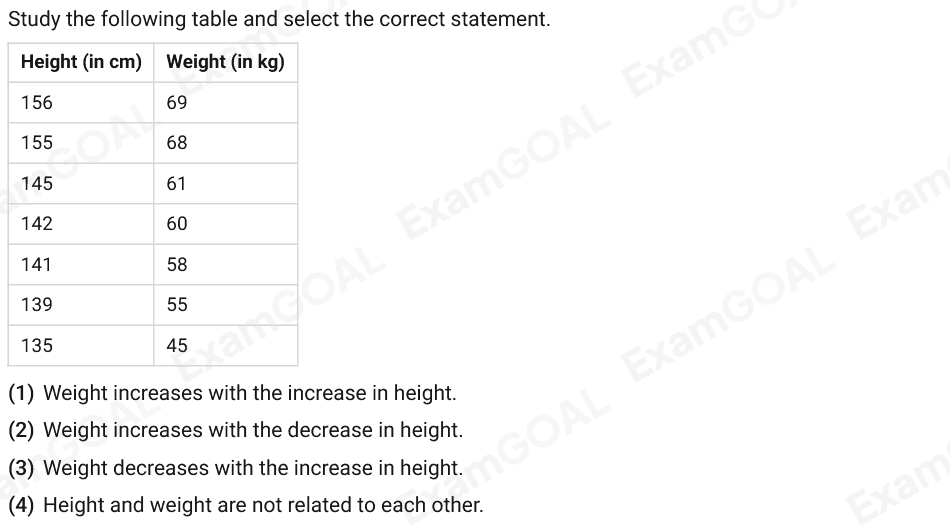
Study the following table and select the correct statement. Height (in cm) Weight (in kg) 156 69 155 68 145 61 142 60 141 58 139 55 135 45
Answer: A