182 questions asked across 4 exam years, newest first
11 संख्याओं का औसत 68 है। यदि प्रथम पाँच का औसत 63 है और अंतिम पाँच का औसत 72 है, तो छठी संख्या ज्ञात कीजिए।
Answer: A
300 और 450 के बीच उन सभी पूर्णांकों का औसत क्या है जो 13 से पूर्णतः विभाज्य हैं?
Answer: B
150 विद्यार्थियों (केवल लड़के और लड़कियाँ) की एक कक्षा में 60 लड़कियाँ हैं। लड़कों का औसत वजन 52 kg है और लड़कियों का औसत वजन 48 kg है। पूरी कक्षा का औसत वजन (kg में) क्या है?
Answer: D
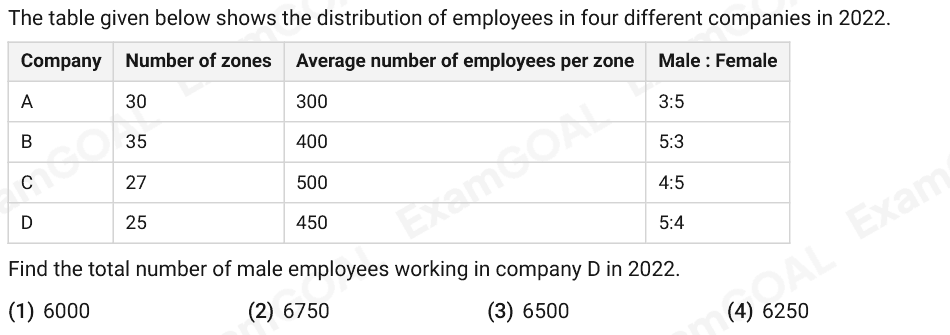
The table given below shows the distribution of employees in four different companies in 2022. Company Number of zones Average number of employees per zone Male : Female A 30 300 3:5 B 35 400 5:3 C 27 500 4:5 D 25 450 5:4 Find the total number of male employees working in company D in 2022.
Answer: D
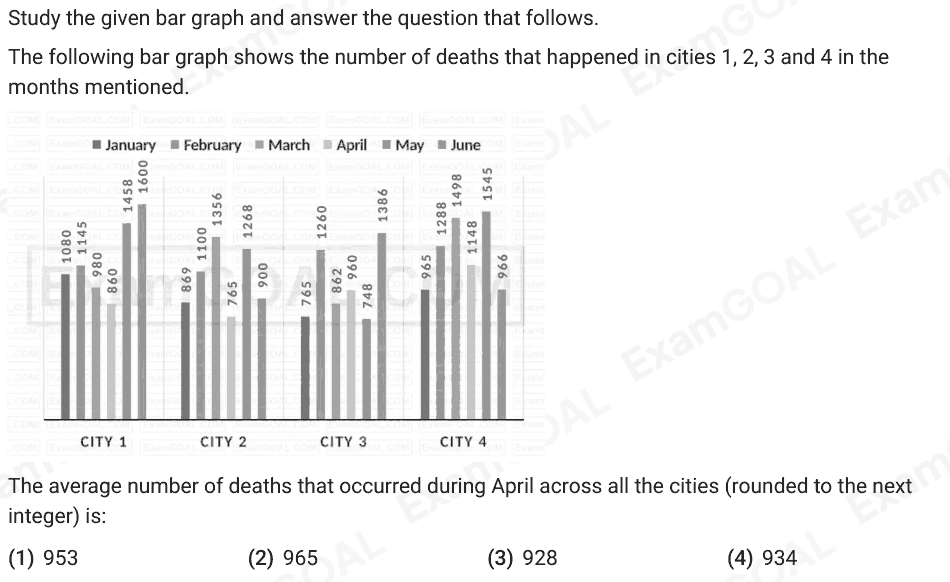
Study the given bar graph and answer the question that follows. The following bar graph shows the number of deaths that happened in cities 1, 2, 3 and 4 in the months mentioned. The average number of deaths that occurred during April across all the cities (rounded to the next integer) is:
Answer: D
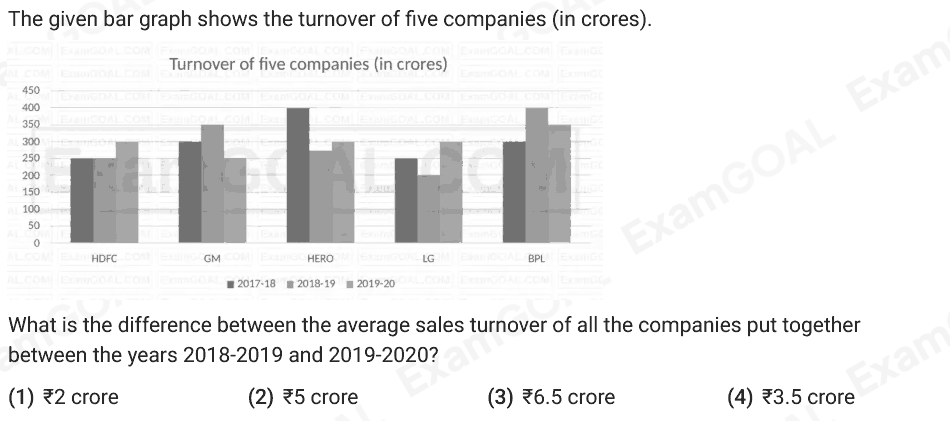
The given bar graph shows the turnover of five companies (in crores). What is the difference between the average sales turnover of all the companies put together between the years 2018-2019 and 2019-2020?
Answer: B
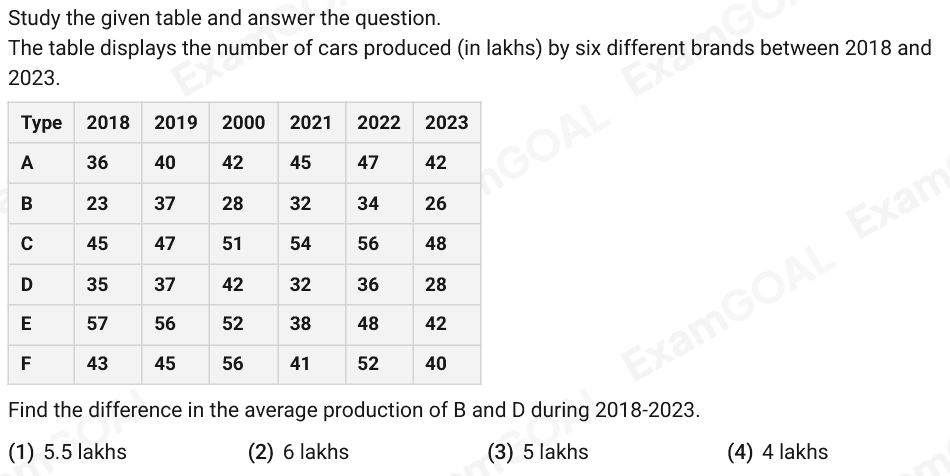
Study the given table and answer the question. The table displays the number of cars produced (in lakhs) by six different brands between 2018 and 2023. Type 2018 2019 2000 2021 2022 2023 A 36 40 42 45 47 42 B 23 37 28 32 34 26 C 45 47 51 54 56 48 D 35 37 42 32 36 28 E 57 56 52 38 48 42 F 43 45 56 41 52 40 Find the difference in the average production of B and D during 2018-2023.
Answer: C
प्रथम 48 प्राकृतिक संख्याओं के वर्गों का औसत ज्ञात कीजिए।
Answer: A
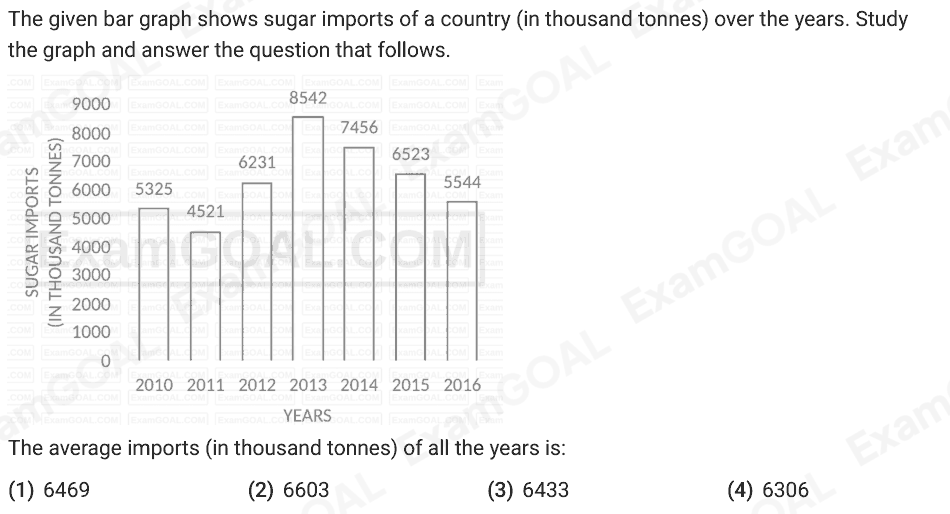
The given bar graph shows sugar imports of a country (in thousand tonnes) over the years. Study the graph and answer the question that follows. The average imports (in thousand tonnes) of all the years is:
Answer: D
30 विद्यार्थियों वाली 8वीं कक्षा में, गणित की परीक्षा ली गई। 10 विद्यार्थियों का औसत स्कोर 90 था। अन्य विद्यार्थियों का औसत स्कोर 75 था। पूरी कक्षा का औसत स्कोर ज्ञात करें।
Answer: C
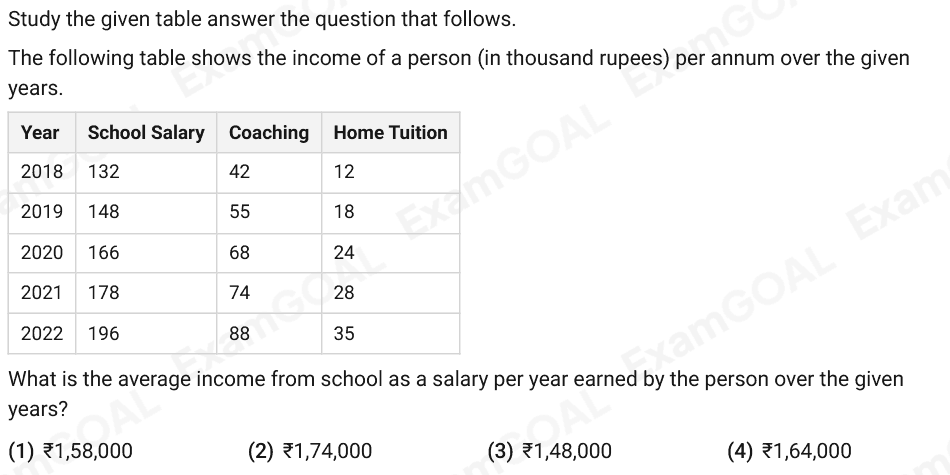
Study the given table answer the question that follows. The following table shows the income of a person (in thousand rupees) per annum over the given years. Year School Salary Coaching Home Tuition 2018 132 42 12 2019 148 55 18 2020 166 68 24 2021 178 74 28 2022 196 88 35 What is the average income from school as a salary per year earned by the person over the given years?
Answer: D
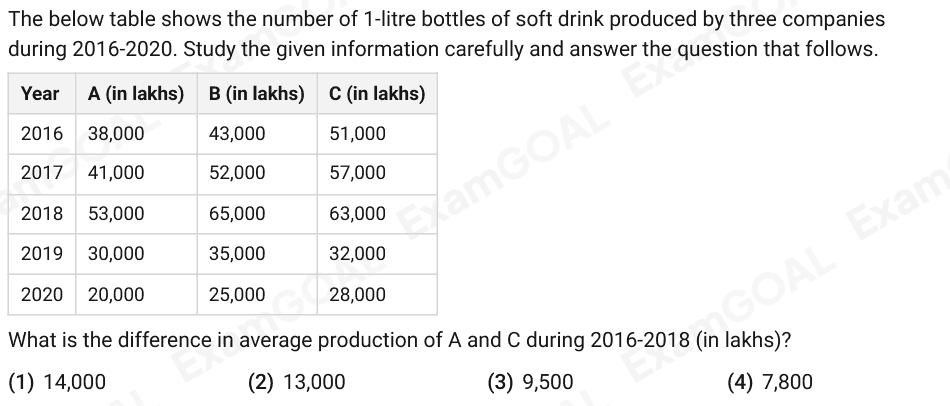
The below table shows the number of 1-litre bottles of soft drink produced by three companies during 2016-2020. Study the given information carefully and answer the question that follows. Year A (in lakhs) B (in lakhs) C (in lakhs) 2016 38,000 43,000 51,000 2017 41,000 52,000 57,000 2018 53,000 65,000 63,000 2019 30,000 35,000 32,000 2020 20,000 25,000 28,000 What is the difference in average production of A and C during 2016-2018 (in lakhs)?
Answer: B
30 छात्रों वाली एक कक्षा के सभी छात्रों ने एक टेस्ट दिया। 12 छात्रों का औसत स्कोर 60 है, और बाकी छात्रों का औसत स्कोर 80 है। कक्षा का औसत स्कोर ज्ञात करें।
Answer: B
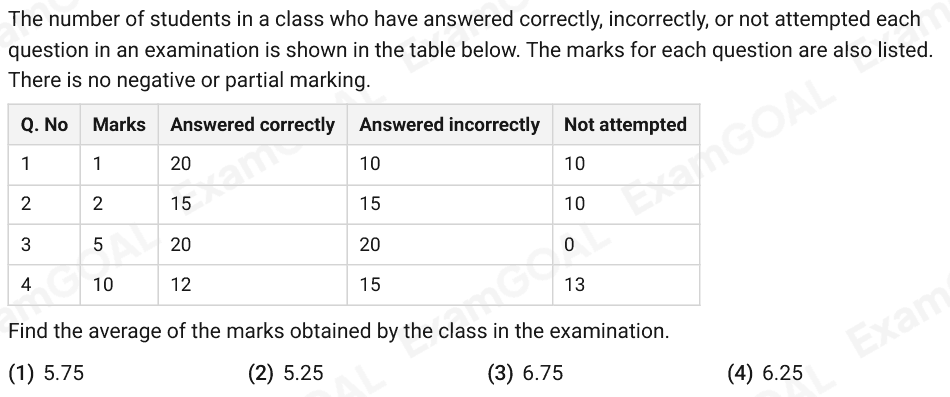
The number of students in a class who have answered correctly, incorrectly, or not attempted each question in an examination is shown in the table below. The marks for each question are also listed. There is no negative or partial marking. Q. No Marks Answered correctly Answered incorrectly Not attempted 1 1 20 10 10 2 2 15 15 10 3 5 20 20 0 4 10 12 15 13 Find the average of the marks obtained by the class in the examination.
Answer: C
30 छात्रों वाली एक कक्षा के सभी छात्रों ने एक टेस्ट दिया। 12 छात्रों का औसत स्कोर 62 है और बाकी छात्रों का औसत स्कोर 78 है। कक्षा का औसत स्कोर ज्ञात करें।
Answer: B
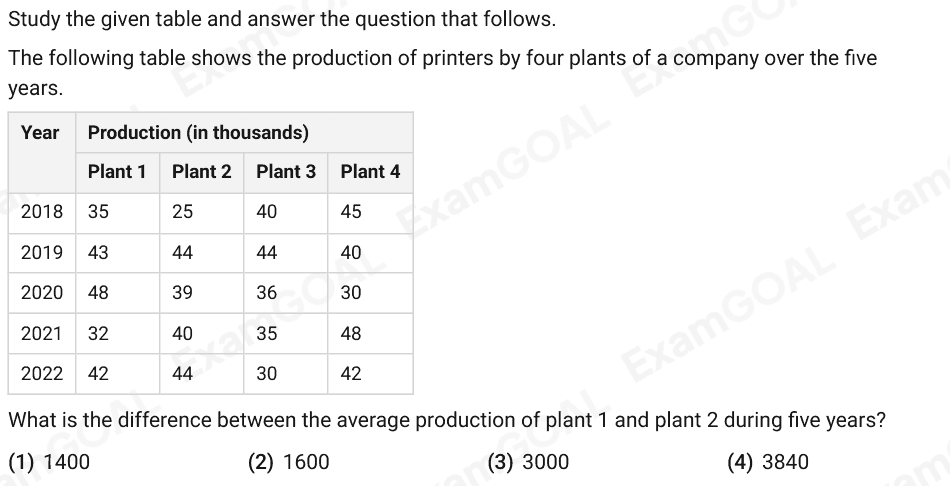
Study the given table and answer the question that follows. The following table shows the production of printers by four plants of a company over the five years. Year Production (in thousands) Plant 1 Plant 2 Plant 3 Plant 4 2018 35 25 40 45 2019 43 44 44 40 2020 48 39 36 30 2021 32 40 35 48 2022 42 44 30 42 What is the difference between the average production of plant 1 and plant 2 during five years?
Answer: B
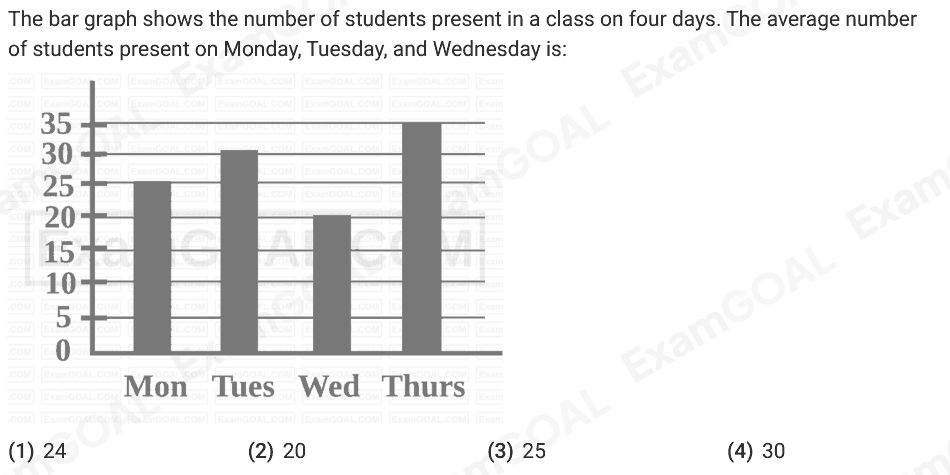
The bar graph shows the number of students present in a class on four days. The average number of students present on Monday, Tuesday, and Wednesday is:
Answer: C
सात सदस्यों की एक टीम में, छः सदस्यों की औसत आयु 42 वर्ष है जबकि टीम के सातवें सदस्य की आयु, सभी सात सदस्यों की औसत आयु से 36 वर्ष अधिक है। टीम के सातवें सदस्य की आयु (वर्ष में) ज्ञात करें।
Answer: A
30 छात्रों वाली एक कक्षा के सभी छात्रों ने एक टेस्ट दिया। 12 छात्रों का औसत स्कोर 62 है, और बाकी छात्रों का औसत स्कोर 60 है। कक्षा का औसत स्कोर ज्ञात करें।
Answer: A
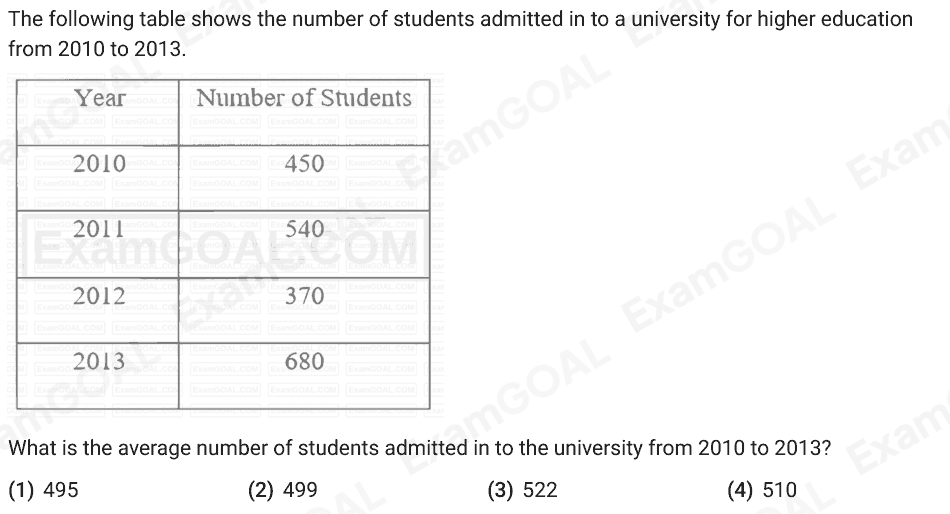
The following table shows the number of students admitted in to a university for higher education from 2010 to 2013. What is the average number of students admitted in to the university from 2010 to 2013?
Answer: D
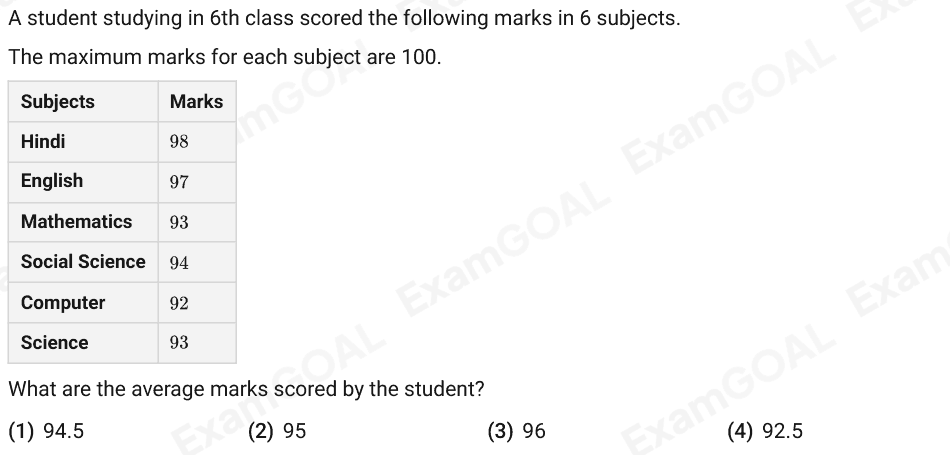
A student studying in 6th class scored the following marks in 6 subjects. The maximum marks for each subject are 100. Subjects Marks Hindi English Mathematics Social Science Computer Science What are the average marks scored by the student?
Answer: A
एक बल्लेबाज का बीस मैचों में औसत स्कोर 15 है और पच्चीस अन्य मैचों में औसत स्कोर 24 है। सभी पैंतालीस मैचों में औसत स्कोर ज्ञात कीजिए।
Answer: B
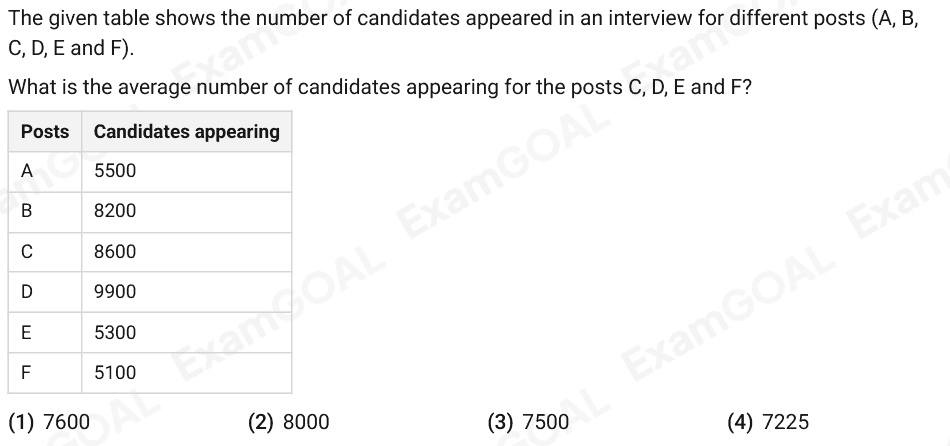
The given table shows the number of candidates appeared in an interview for different posts (A, B, C, D, E and F). What is the average number of candidates appearing for the posts C, D, E and F? Posts Candidates appearing A 5500 B 8200 C 8600 D 9900 E 5300 F 5100
Answer: D
30 छात्रों वाली एक कक्षा के सभी छात्रों ने एक टेस्ट दिया। 12 छात्रों का औसत स्कोर 62 है और बाकी छात्रों का औसत स्कोर 68 है। कक्षा का औसत स्कोर ज्ञात करें।
Answer: C
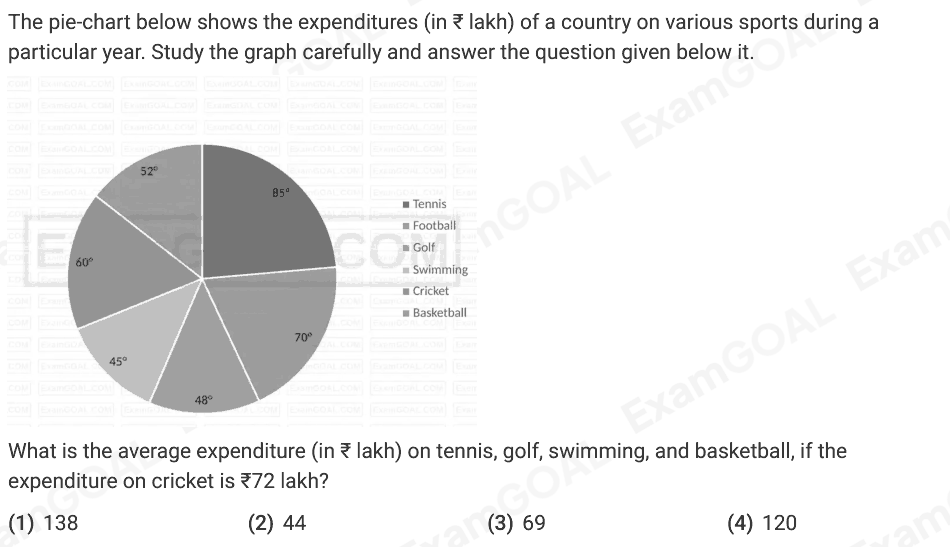
The pie-chart below shows the expenditures (in ₹ lakh) of a country on various sports during a particular year. Study the graph carefully and answer the question given below it. What is the average expenditure (in ₹ lakh) on tennis, golf, swimming, and basketball, if the expenditure on cricket is ₹72 lakh?
Answer: C