182 questions asked across 4 exam years, newest first
Shatabdi Express train covers 700 km in 5 hours and another 1012 km in 11 hours. What is the average speed of the train (in metres/second)?

Answer: C
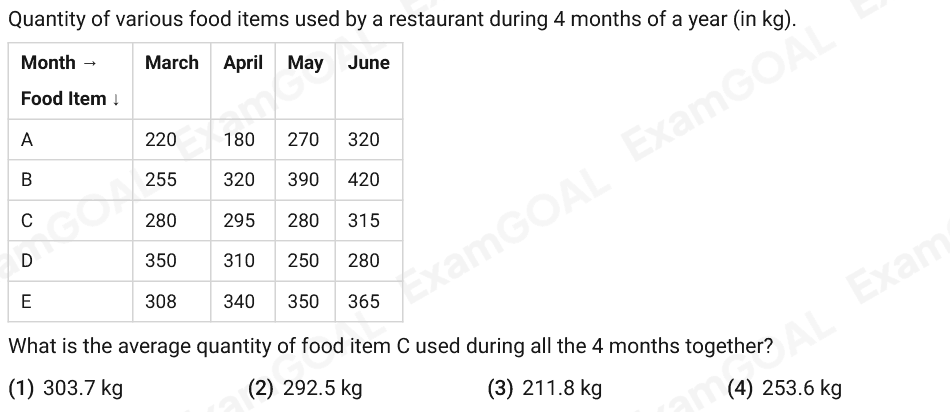
Quantity of various food items used by a restaurant during 4 months of a year (in kg). Month → Food Item ↓ March April May June A 220 180 270 320 B 255 320 390 420 C 280 295 280 315 D 350 310 250 280 E 308 340 350 365 What is the average quantity of food item C used during all the 4 months together?
Answer: B
सुधीन ने 4 घंटे के लिए 8.5 km/h की चाल से साइकिल चलाई, फिर एक ऑटो लिया और 1.5 के लिए 20 km/h की चाल से यात्रा की, और फिर y घंटे के लिए 4 km/h की चाल से चला। यदि पूरी यात्रा में सुधीन की कुल औसत चाल 10 km/h थी, तो y का मान क्या है?
Answer: C
एक परिवार में 3 सदस्य हैं। पिता और माता की औसत आयु 40 वर्ष है। पिता, माता और पुत्री की औसत आयु 30 वर्ष है। पुत्री की आयु (वर्षों में) ज्ञात कीजिए।
Answer: C
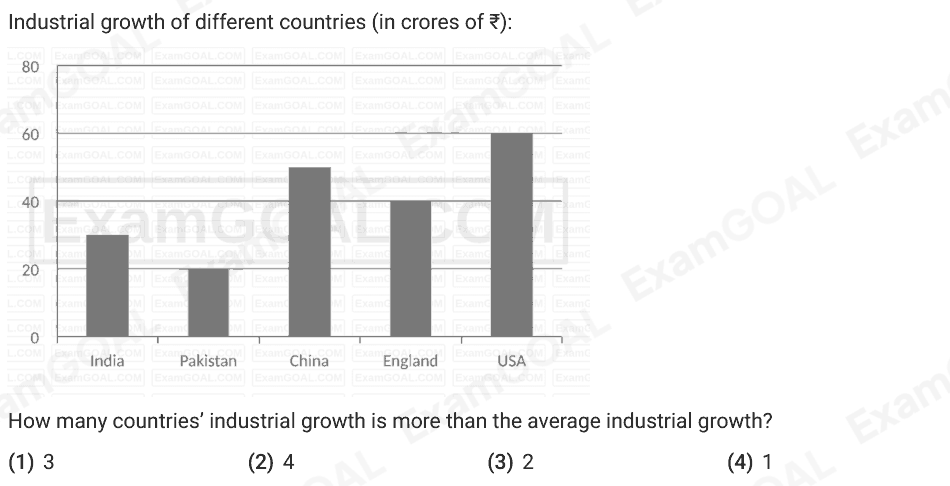
Industrial growth of different countries (in crores of ₹): How many countries’ industrial growth is more than the average industrial growth?
Answer: C
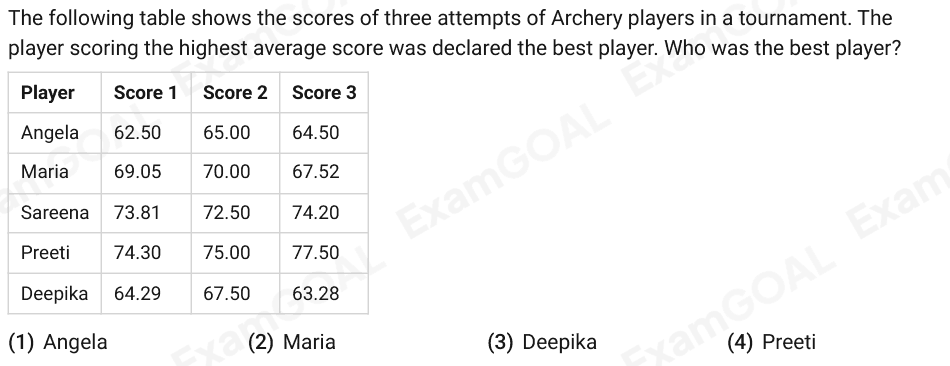
The following table shows the scores of three attempts of Archery players in a tournament. The player scoring the highest average score was declared the best player. Who was the best player? Player Score 1 Score 2 Score 3 Angela 62.50 65.00 64.50 Maria 69.05 70.00 67.52 Sareena 73.81 72.50 74.20 Preeti 74.30 75.00 77.50 Deepika 64.29 67.50 63.28
Answer: D
एक कॉलेज के 20 विद्यार्थी एक होटल में गए। उनमें से 19 में से प्रत्येक ने अपने भोजन पर ₹175 खर्च किए और 20वें विद्यार्थी ने सभी 20 के औसत से ₹19 अधिक खर्च किए। उनके द्वारा खर्च की गई कुल राशि ज्ञात करें।
Answer: C
अपनी यात्रा के एक भाग के रूप में, एक व्यक्ति 80 km/h की चाल से 120 km की यात्रा करता है, अगले 100 km की यात्रा 40 km/h की चाल से करता है, और 75 km/h की चाल से प्रारंभिक स्थान पर वापस आता है। पूरी यात्रा में व्यक्ति की औसत चाल (लगभग) ________ है।
Answer: A
36 संख्याओं का औसत 45 पाया गया। बाद में यह पाया गया कि 84 को गलती से 48 पढ़ लिया गया था। दी गई संख्याओं का सही औसत ज्ञात करें।
Answer: C
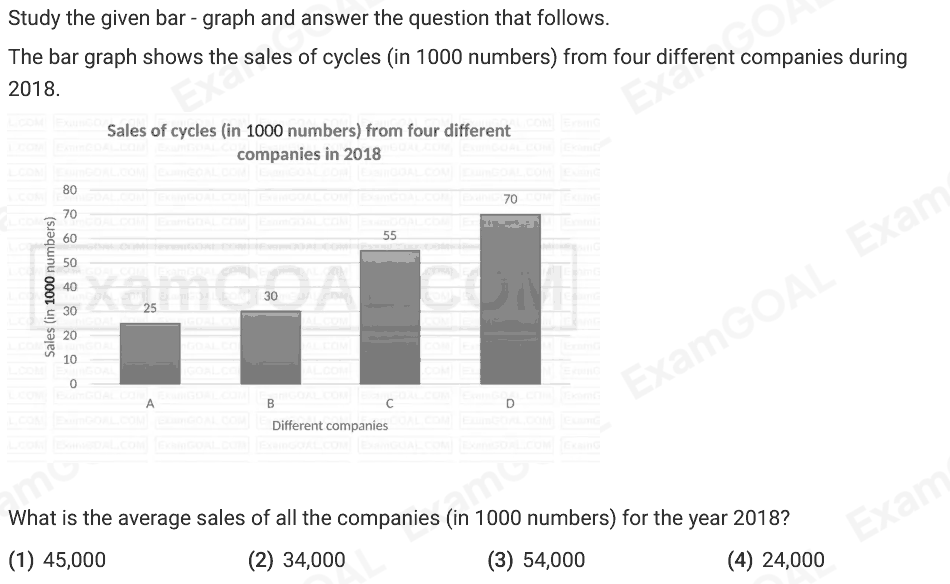
Study the given bar - graph and answer the question that follows. The bar graph shows the sales of cycles (in 1000 numbers) from four different companies during 2018. What is the average sales of all the companies (in 1000 numbers) for the year 2018?
Answer: A